Sticky |December 16, 2021|Dawid Tadel|in category CompanyComments Off on Public holiday notice for 2024
Dear Customers,
We wish to advise that our office in Krakow will be closed on the following days during 2024:
January 1 (Monday) April 1 (Monday) May 1 (Wednesday) May 3 (Friday) May 30 (Thursday) August 15 (Thursday) November 1 (Friday) November 11 (Monday) December 25 (Wednesday) December 26 (Thursday)
Our sales staff will be unavailable on this day, including both phone and email, so responses to your queries may be delayed. Thank you for your understanding,
February 17, 2021|Dawid Tadel|in category License StatisticsComments Off on Generating Custom Reports from License Statistics with Microsoft Power BI
License Statistics customers can use Microsoft Power BI to build customized reports or combine the data it provides with data from other tools to build a unified dashboard.
Microsoft Power BI is a business analytics platform that provides interactive data visualizations for business intelligence (BI). Many X-Formation customers use it to build custom business dashboards to gain insight into key metrics throughout their organizations. The License Statistics API gives you complete access to all the data it tracks, allowing you to integrate it with your own reports and tools.
This article provides an example of how to use data from the License Statistics API to create a custom report.
Scenario
We want to create a Usage History report for a particular feature presenting minimum, maximum usage, and total number of licenses used daily during a selected period of time.
Requirements
A running License Statistics instance
The Microsoft Power BI Desktop application installed
Steps
Accessing the License Statistics API
Adding a Web data source to Power BI
Preparing data
Creating a report
Accessing the License Statistics API
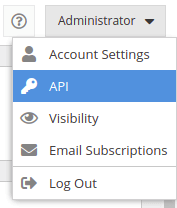
To begin, you must create a token with API scope. Create one by accessing the License Statistics API section in the personal context menu:
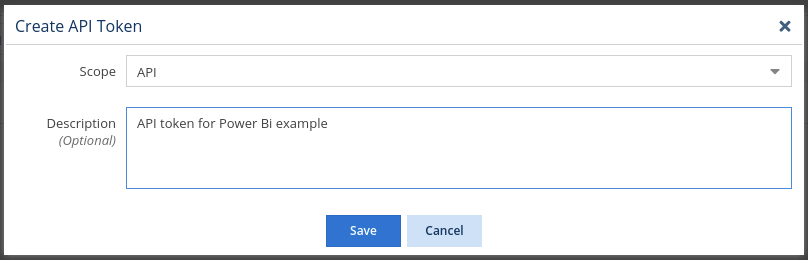
Use the Add button to create a new token with API scope.
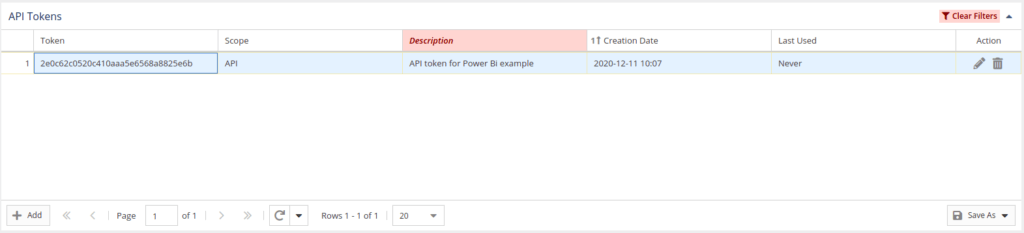
Save the new API token. It now appears in the API Tokens grid.
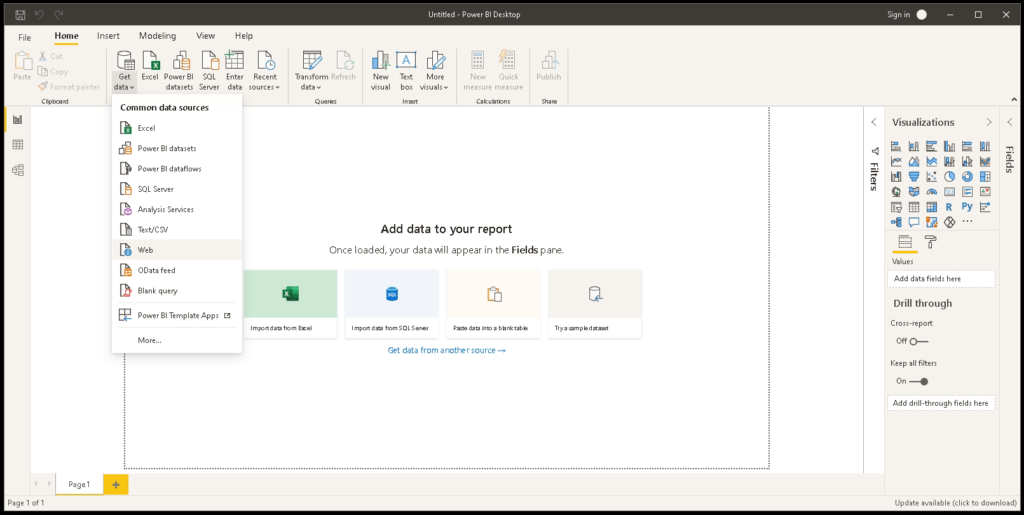
In the Power BI Desktop, create a new report and add a Web data source from the Get Data menu.
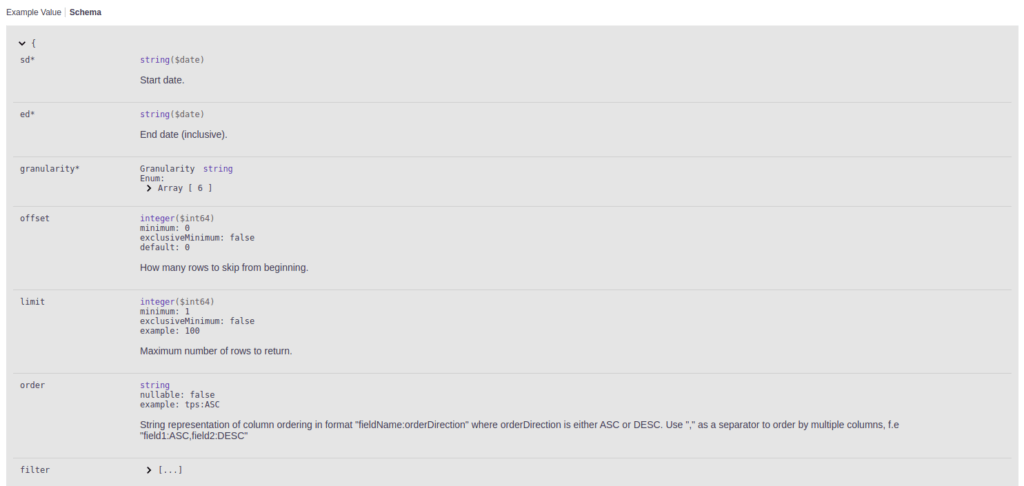
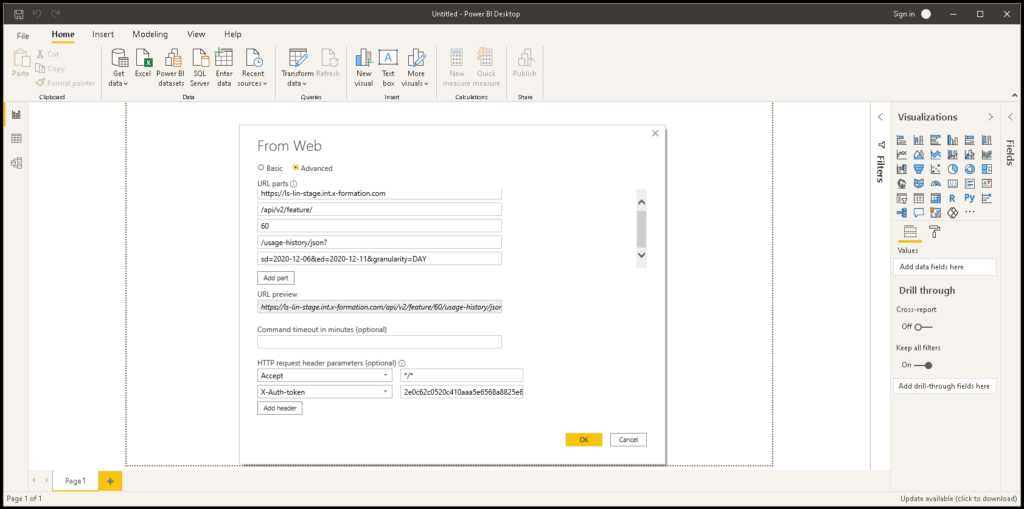
Complete the form presented to you. Use the Advanced option to add API endpoints. For our example we’ll use the /api/v2/feature/{id}/usage-history/json endpoint. (See a complete list of API endpoints in the interactive API documentation.)
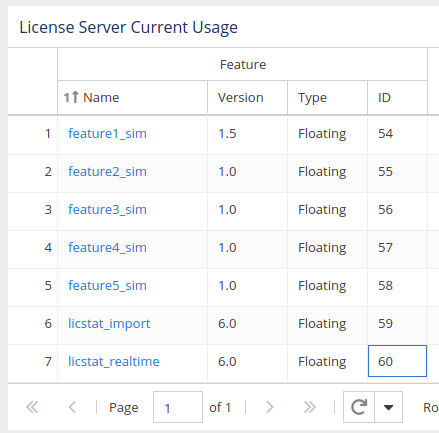
The Feature ID (set to 60 in our example) can be taken using the /api/v2/feature/list endpoint, but also can be taken from the License Statistics UI by displaying the Feature ID column (hidden by default) on any grid.
Let’s set the query parameters for a start date of December 6, 2020, and an end date of December 11, 2020:
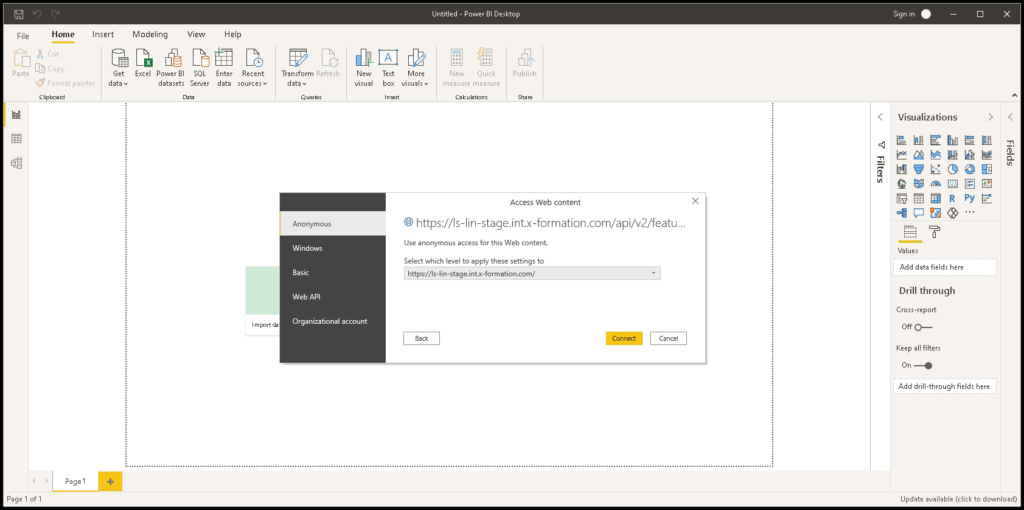
When asked, use the Anonymous access option. Authorization has been already handled by the token added to the header in the previous step.
Use the Connect button to access the defined Web source and get requested data.
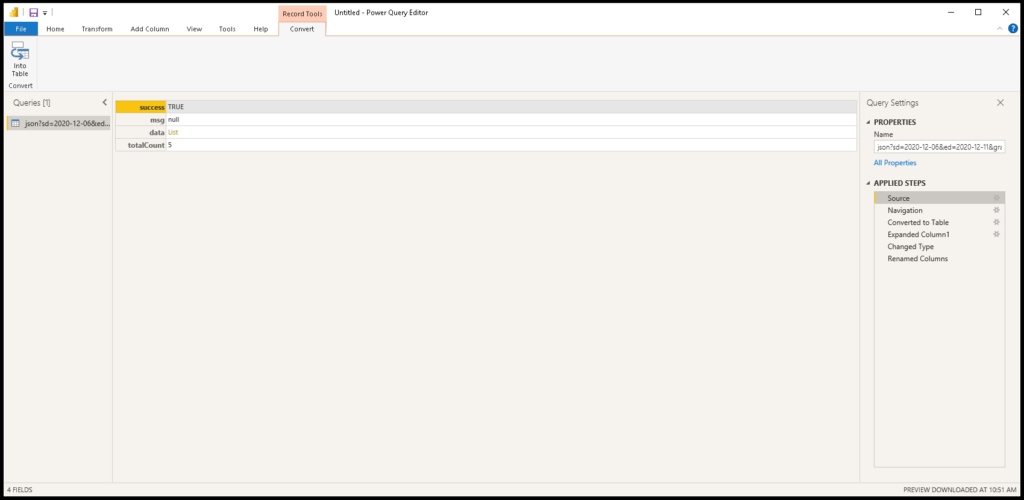
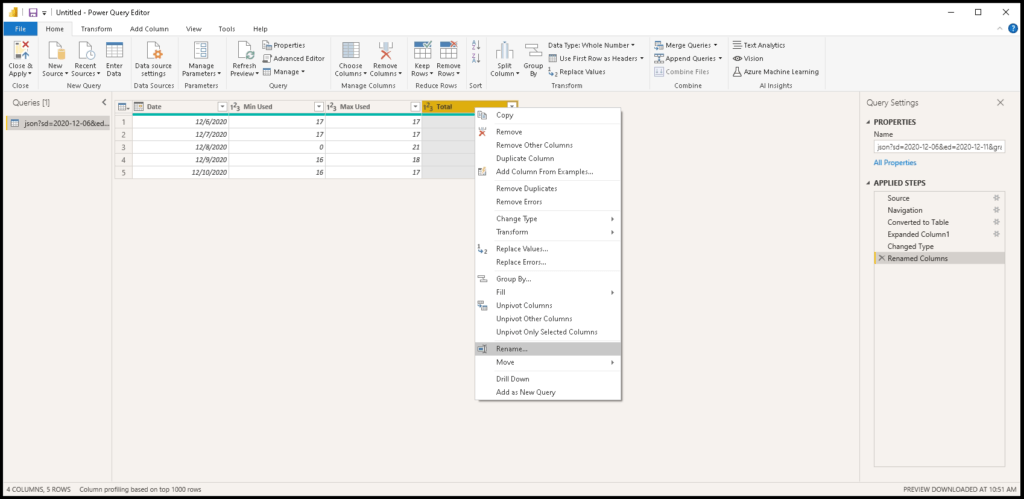
Preparing data
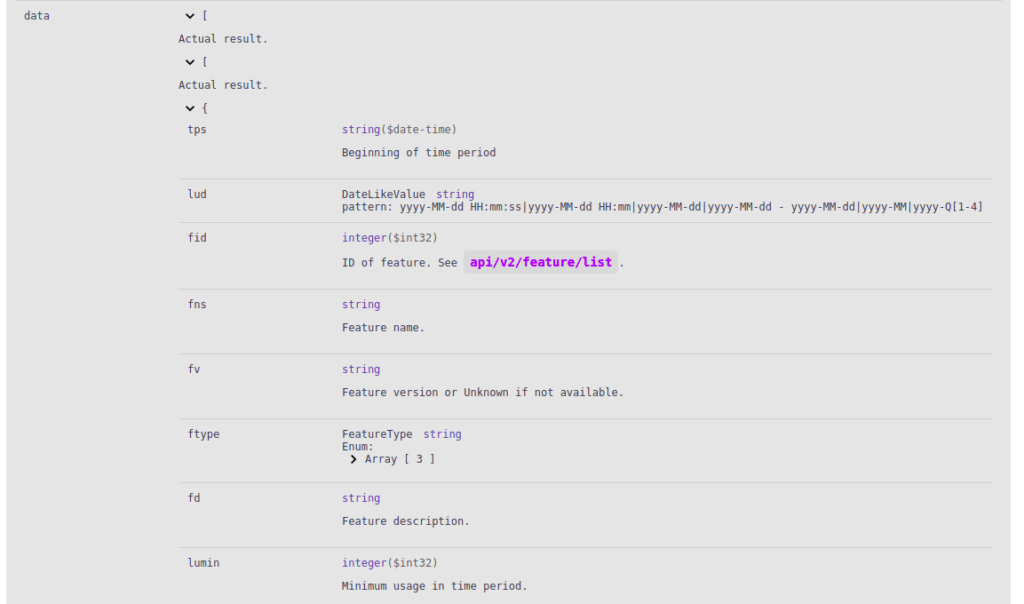
Data received from the License Statistics API must be formatted before you can read it.
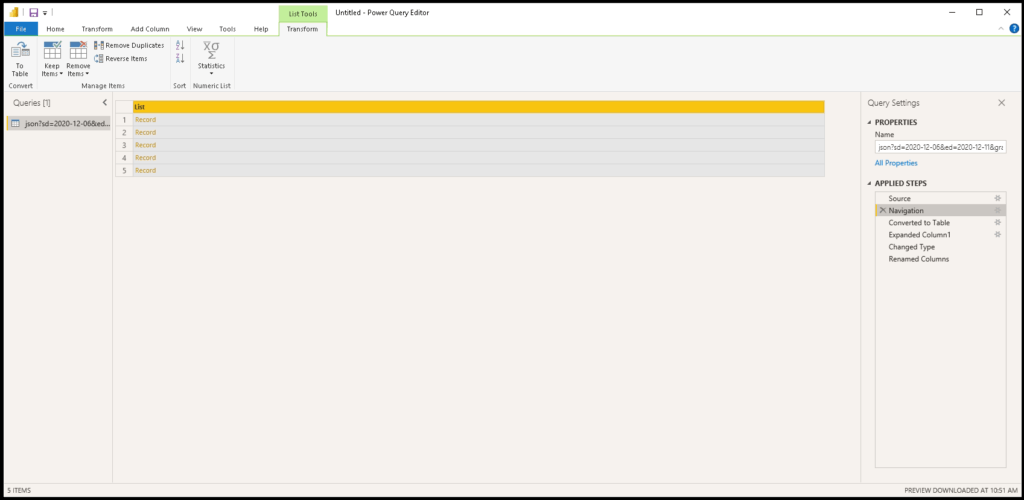
Use the List link to navigate to the data key details.
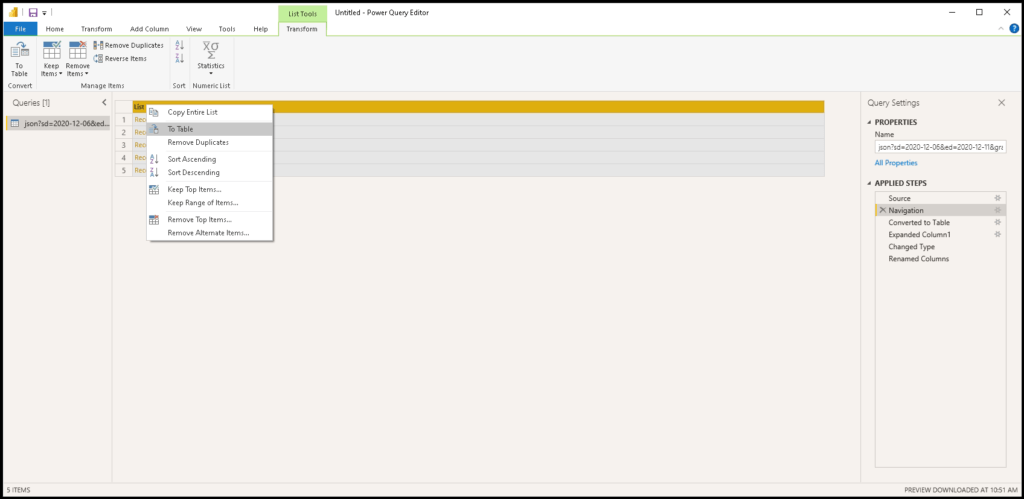
Convert the list of records to a table using the To Table option.
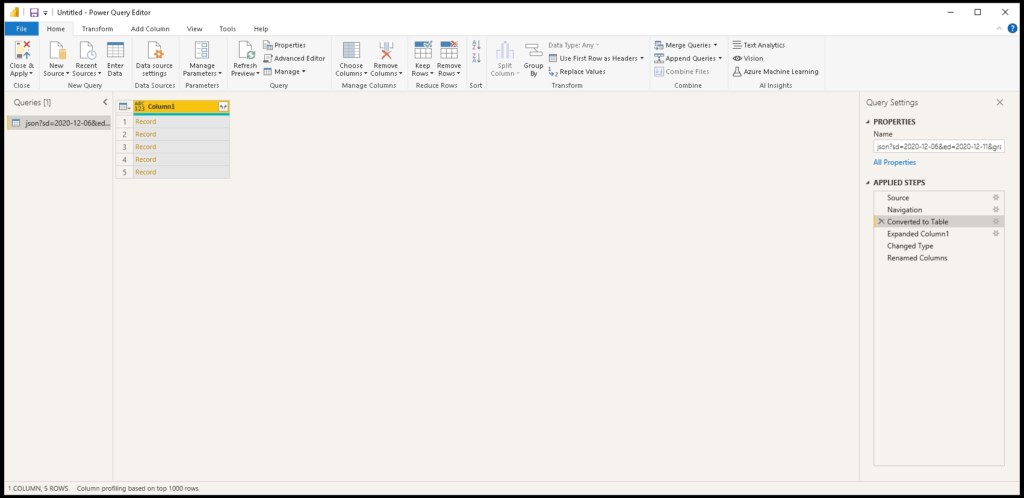
Your results are displayed as shown below.
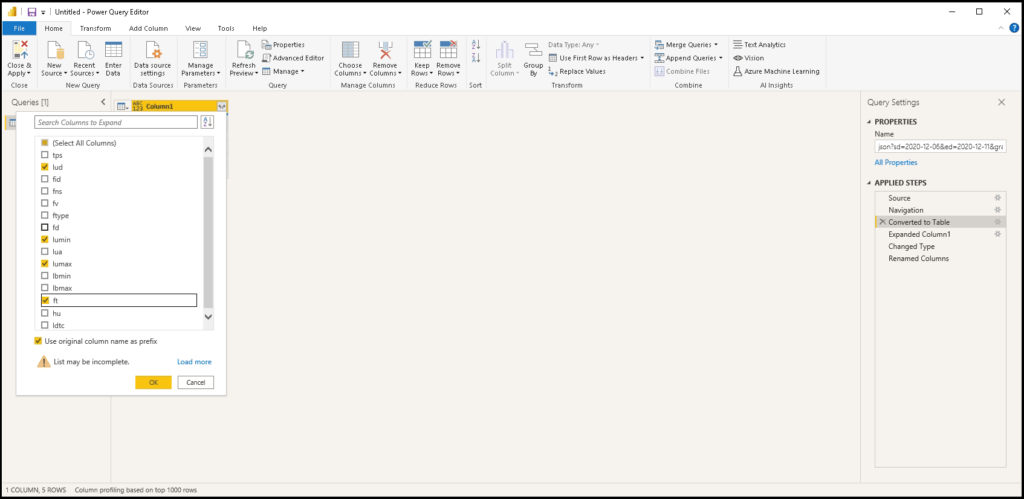
The resulting Table of records can be expanded to include multiple columns. We don’t need all the fields from the response to achieve our goal, so we’ll select only those which are needed in our scenario:
lud (date)
lumin (min used)
lumax (max used)
ft (total)
Note: You can also set a list of returned columns using the fieldsVisibility request parameter.
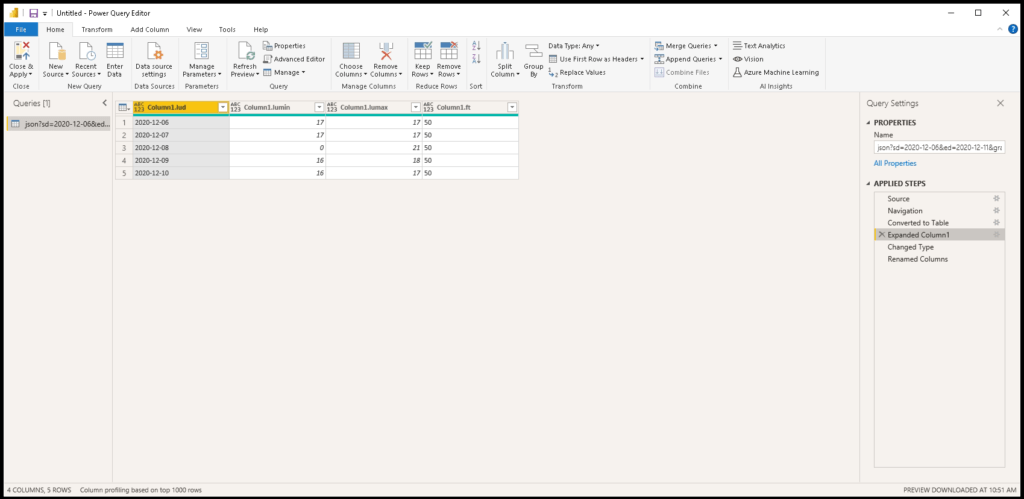
The table will be expanded to a multi-column view.
Note: A full list of the parameters with description is available in the interactive documentation.
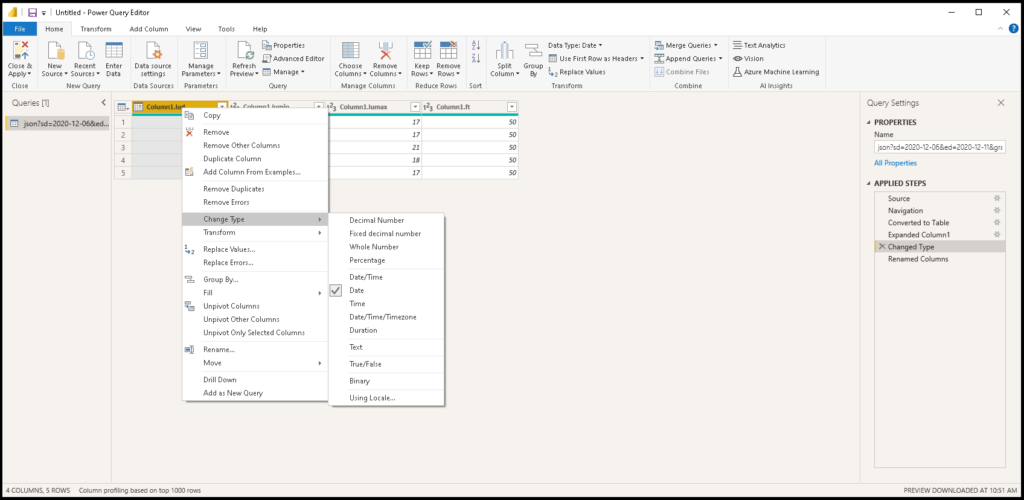
For proper processing we need to define the type of data for each column. In our case, the lud property is a Date type, while the rest of the properties are Whole Numbers.
Rename the columns to present them more clearly in reports.
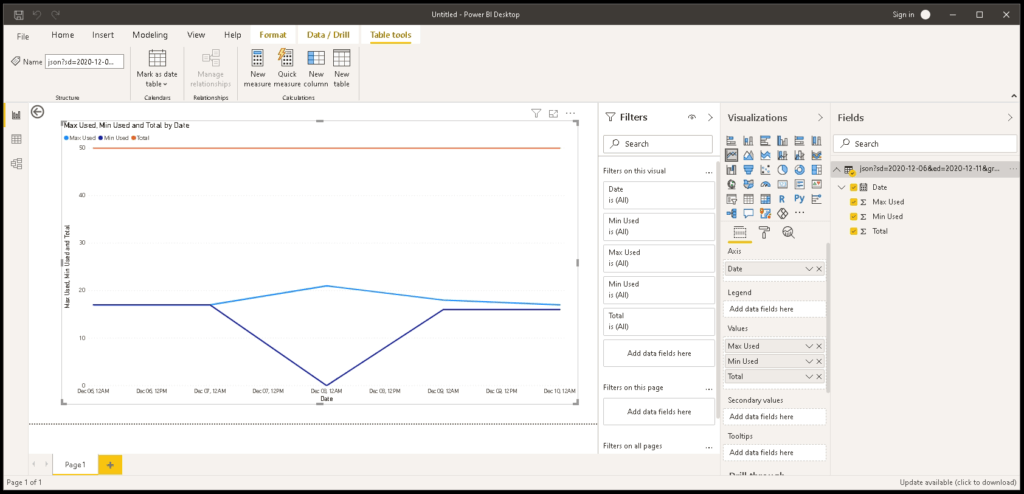
Creating a Report
Once you have prepared the data source, you can use the data to create your custom report. We chose to create a line chart. On the X Axis there is a Date, and on the Y Axis we have values from 3 data series: Max Used, Min Used, and Total.
You can see from this basic example that with powerful visualization tools like Microsoft Power BI and rich data from the License Statistics API you can bring even greater value to your company in the areas of license management and optimization.
As always, the X-Formation team loves to hear your feedback and suggestions for new features. If you have ideas or need help, please contact support@x-formation.com or contact your X-Formation representative.
January 28, 2021|Dawid Tadel|in category License StatisticsComments Off on User History Data with Usage Calendar and Session History Charts
Gain deeper insight into User History data than ever before with License Statistics v6.9. The new User History Gantt chart lets you view license use for a selected feature by user session on any day or time you choose.
Starting with v6.9, License Statistics provides even more granular data about User History. You can now see all sessions for users who use licenses for any feature you select, on any date or at any time you choose. The new User History Gantt chart, part of the Usage Calendar, presents the data you want in a simple, easy-to-read format.
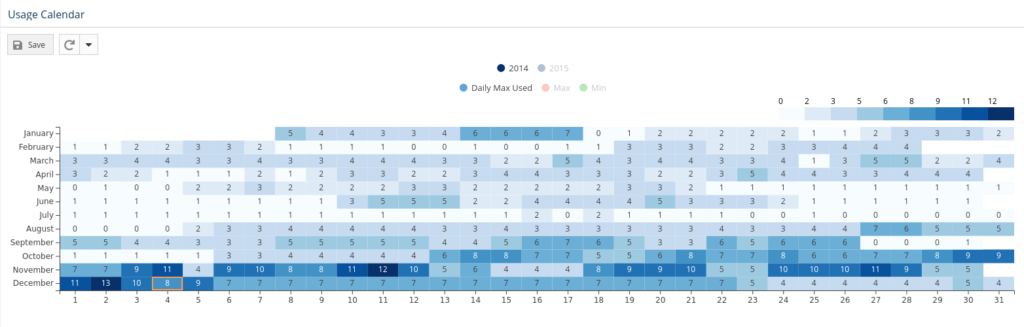
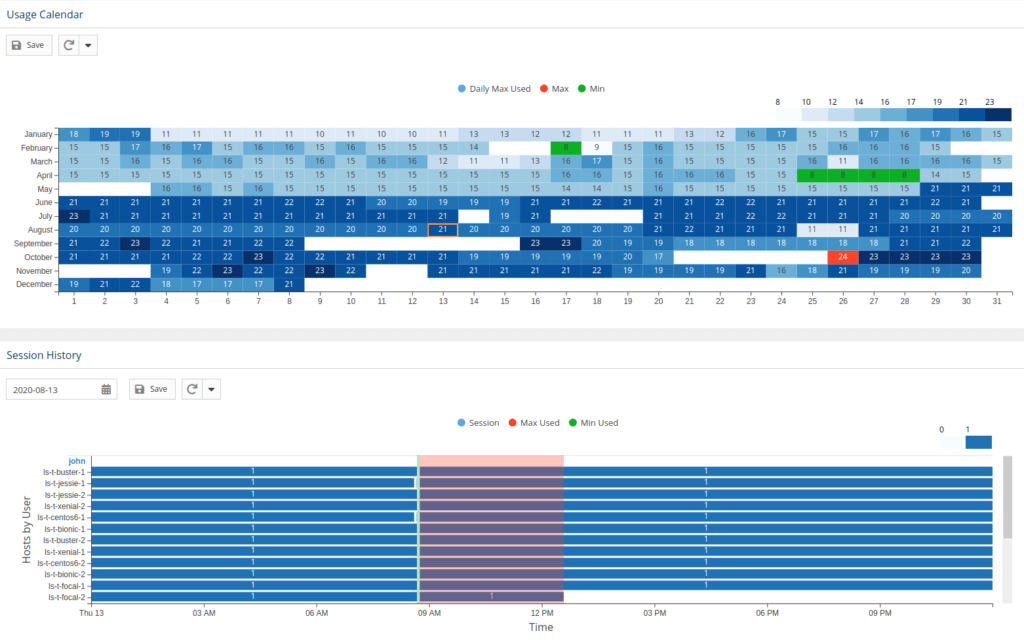
The Usage Calendar and Session History Charts
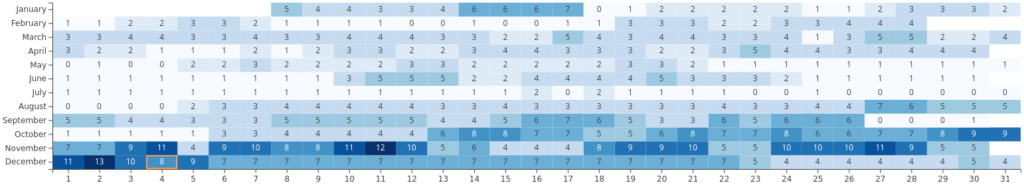
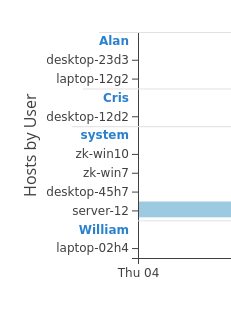
The Usage Calendar shows daily maximum usage of a selected feature for a chosen date range you choose in page settings. The chart is a heatmap with the month on the vertical axis, and the day of the month on the horizontal axis.
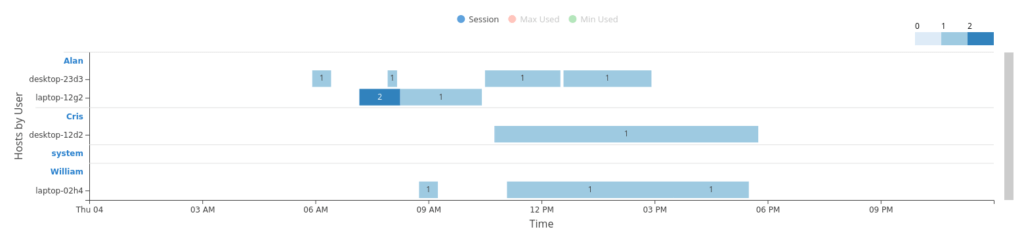
The Session History chart displays a Gantt chart showing user sessions for concurrent hosts.
Viewing the Usage Calendar
You can view data for any date or range of dates with the Usage Calendar.
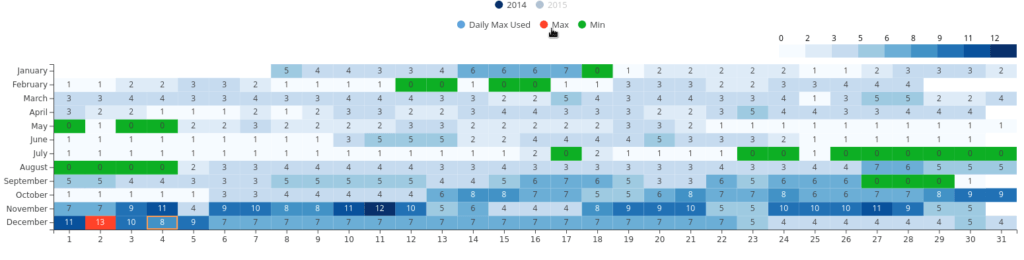
You can even view the entire year at once, and easily switch between years using the buttons in the legend above the chart.
The Usage Calendar shows both minimum and maximum usage for the date range you selected in settings, and for the year selected on the chart’s legend.
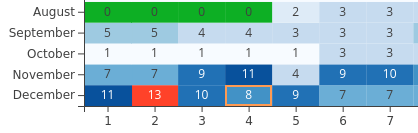
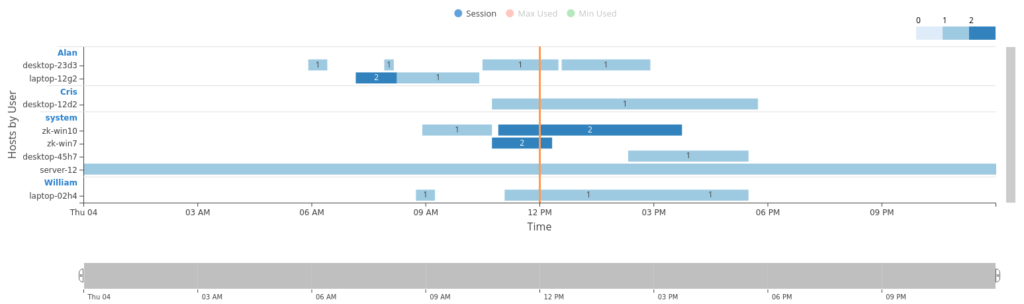
Click any day to view its Session History chart, where you will find detailed data about usage on that day. The day you select is marked with an orange border.
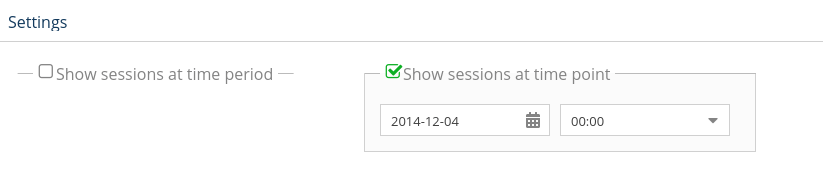
Note: When you are viewing the session at a selected time point, the Chart is hidden.
How to View the Session History Chart
Go to Features → User History page.
On the Usage Calendar, click the day you are interested in. (If you are on the Settings page, you can use the “Show sessions at time point” section to go directly to any day you choose.)
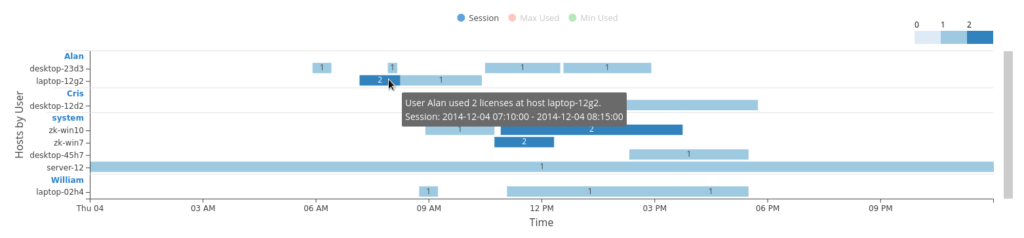
Your Session History chart for the chosen day will then display a Gantt chart with user sessions for concurrent hosts.
How to Use the Session History chart:
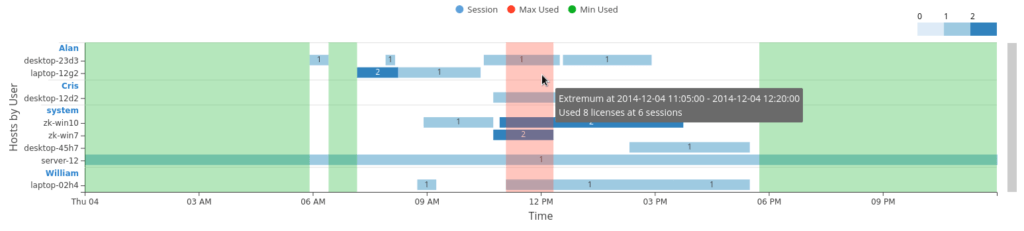
The Y axis of the Session History chart groups all hosts by user.
Click the user name (highlighted in blue) to expand or close the hosts view for that user:
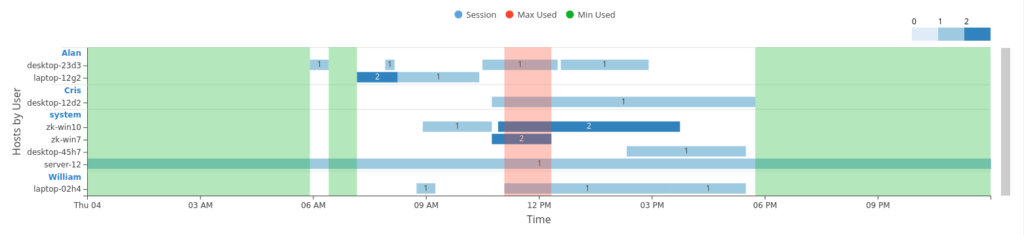
Click Max Used or Min Used to highlight extremas in user data:
Hover the pointer over an extremum, and a tooltip appears providing more information about the extremum:
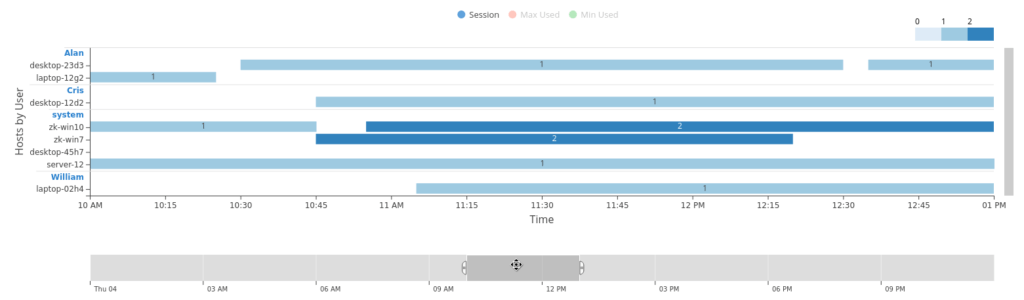
Use the time range brush below the chart to set the range of time you wish to view, or use it to create a PNG report file for a smaller range of time:
Select a specific point in time to view sessions at that time point:
As you’ve seen, License Statistics makes it easier than ever to gather the User History data you need to make better decisions. The data you want is presented in a way that gives you greater insight into license usage throughout the organisation. Try the new features and see for yourself.
As always, the X-Formation team loves to hear your feedback and suggestions for new features. If you have ideas or need help, please contact support@x-formation.com or contact your X-Formation representative.
December 9, 2020|Dawid Tadel|in category License StatisticsComments Off on Set It and Forget It: License Harvesting and License Statistics v6.10
License Statistics v6.10 brings the next evolution of License Harvesting with automatic remote license release and monitored application events grid. A new, detailed Session History chart rounds out the advances this time around.
The License Statistics v6.10 release extends the power and utility of License Harvesting through implementation of automatic remote license release. It also provides two new reports, one for historical events that occur with applications monitored for License Harvesting, and a new Session History chart that provides detailed data on feature usage across user sessions.
Discover what the new features will do for you below.
Automatic Remote License Release for LM-X and Flexnet License Servers
The next iteration of License Harvesting gives you even greater control over when idle licenses become available in the license pool. License servers can block license availability for some time even after the Agent has closed an idle end-user application. Without manual intervention, it can take as much as an hour before another user can access an idle license. License servers such as LM-X and Flexnet have begun to provide better hooks for automation tools.
License Statistics v6.10 now provides automatic remote license release for LM-X and Flexnet license servers. This gets idle licenses back into the available license pool just after the Agent has closed the end-user application. No more waiting or manual intervention required – simply set it and forget it.
Here’s how it works:
Select the feature(s) used by the Application on the License Harvesting configuration form.
On each end-user host, License Agent monitors the application using your License Harvesting rules.
When the application is idle, License Agent closes it and immediately notifies License Statistics that the application has been closed.
Based on the information it receives from the License Agent, and upon the features configured for that application, License Statistics executes the command on query tool, which releases the license on the server. The result? The application is closed on the end-user host AND the license is released to the available pool without waiting.
The automatic license release feature is available for LM-X license server and query tool (lmxendutil) version 4.9.24 and later, and for Flexnet license servers.
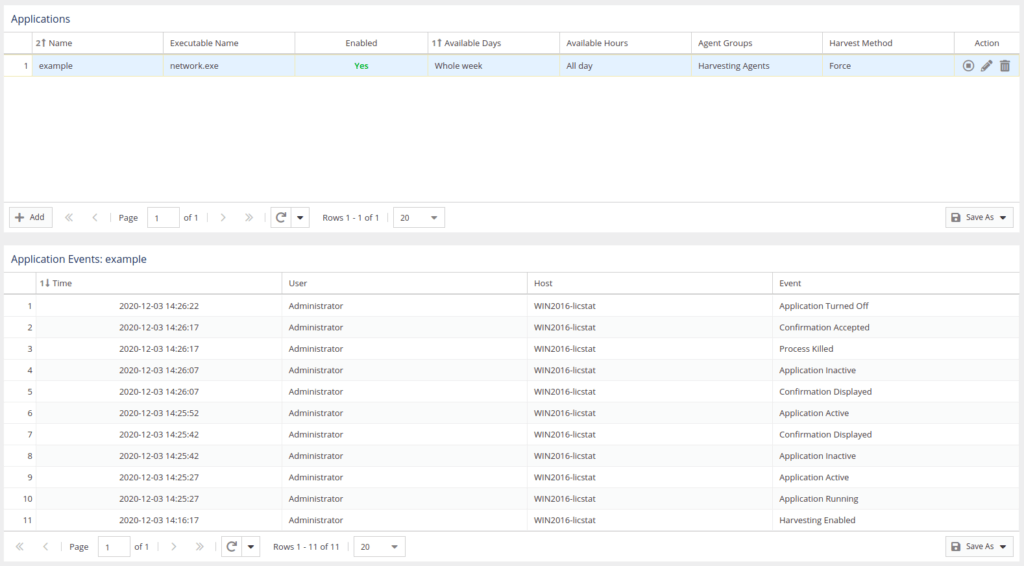
Application Events Grid
License Harvesting – Application Events Grid
Also new with License Statistics v6.10 and enhanced License Harvesting is the License Harvesting – Application Events grid. The grid lists historical events that occur with applications monitored for License Harvesting. The new grid provides a history of actions taken by the License Agent while monitoring the end-user host application for harvesting. Access the grid from the License Harvesting administration page per selected application. The same information is available on the end-user host per License Harvester instance.
Session History
New Session History Provides Deep Dive
The new Session History chart, which gives you a view into the data from the end-user host perspective, is available under Features -> User History. Use it to see all sessions for a selected feature on a selected day per user/host. You can now drill deeper into feature usage across sessions by end-user host, giving you greater insight into when key features are most and least used.
The X-Formation team is devoted to simplifying your license administration tasks through detailed reporting and complete automation of routine tasks – including recapture of idle licenses that would otherwise cost you hundreds of lost productivity hours every month.
As always, please contact support@x-formation.com with your questions. We’ll be delighted to serve you.
October 29, 2020|Dawid Tadel|in category License StatisticsComments Off on How to Cut Floating License Costs with License Harvesting
When your company uses floating licenses, it plays a balancing act. You always need spare capacity, and you don’t want too much of your IT investment locked into licenses that are never used.
You also don’t want your engineers to be denied when they need to use the software. License costs per seat run from $10K to $150K a seat – and that doesn’t include incremental administration costs, nor does it include the cost of maintaining and securing the license servers you need. Saving even the cost of one license makes a big difference in your budget.
With multiple spare licenses per license server, what ends up happening usually is that overall license utilization will be low at any given time. Companies therefore tend to install as few license servers as they can. Of course, with regional differences in licensing costs and deployment, you cannot always do that. So, once again you end up having to purchase more licenses than you really need.
Do the math yourself. Do you know how much your company wastes in unused license fees? There’s a great way to find out: License Harvesting for License Statistics.
License Harvesting helps you eliminate the extra costs associated with purchasing spare licenses by monitoring users’ machines to see when licenses are unused (e.g. due to meetings, coffee breaks, etc.). You can reclaim those licenses automatically instead of letting them sit being wasted. License Harvesting gives you centralized, easy-to-manage control over all floating licenses.
Every company has peak days when the highest number of licenses are used. License Harvesting helps you monitor and respond to such peaks by reducing idle license consumption and automatically return those licenses to the available pool. Simply install License Agent on every end-user host you wish to monitor, then connect the agent to the License Statistics server. Each License Agent monitors the application processes on its end-user host and checks user interaction and/or CPU usage.
The beauty of License Harvesting is that it does not depend on the license server having to monitor individual applications. Harvesting can be applied to all applications on the end-user host.
For a limited time, you can use License Harvesting at no cost to see for yourself how much you can save. Install License Harvesting and you will be able to track the savings through regular harvesting-related check-in reports. You’ll see exactly how it works, and determine how much you can save in unused floating license costs.
Contact us today for your two-month free trial of License Harvesting.
September 22, 2020|Dawid Tadel|in category License StatisticsComments Off on License Statistics v6.9 Gives You Complete Control of License Usage
Licenses Statistics v6.9 features License Harvesting, the innovative way to automatically influence results and control license usage. Reclaim checked out but unused licenses automatically, based on criteria you define. Never again lose productivity due to avoidable license shortages.
Every software license used in your organization represents a big investment of time and cost. Companies commonly use network licensing to help keep those costs down because a network licensing model ensures more effective license use than does a node-locked licensing model.
But no solution is perfect, and with network licensing the biggest bottlenecks come from users who check out a license from the pool – and then neglect to check it back in, leaving it running for hours… overnight… or even over a weekend. When that happens, others cannot access a license and you lose productivity. Virtual working environments make the problem even worse.
But what if you had a way to automatically release a blocked license without the need for administrative assistance, and at the same time improve license availability and resource management?
That is precisely what the new License Harvesting feature in License Statistics v6.9 does for you. Now you can not only monitor and track license usage – you can actually influence and control network license usage. The new License Statistics Agent makes this new level of monitoring and control possible.
What Is License Harvesting?
License Harvesting automatically identifies licenses that have been idle for a certain amount of time, and specifies the criteria for releasing those blocked licenses automatically.
There are several ways to handle license release depending upon configuration and your requirements:
Gracefully ask the user to close the application or continue working;
Close the application gracefully after a set period of user inactivity; or
Force the application to close and immediately reclaim the blocked license.
How does License Harvesting Work?
The License Statistics Agent is the key to implementing and configuring License Harvesting in your organization. It’s a simple operation, as described below.
Install and Configure License Statistics Agents
Install the License Statistics Agent on every end-user host you wish to monitor, then connect the Agent to the License Statistics Server. The Agent monitors whether the application is being actively used and manages idle licenses based on the criteria you establish.
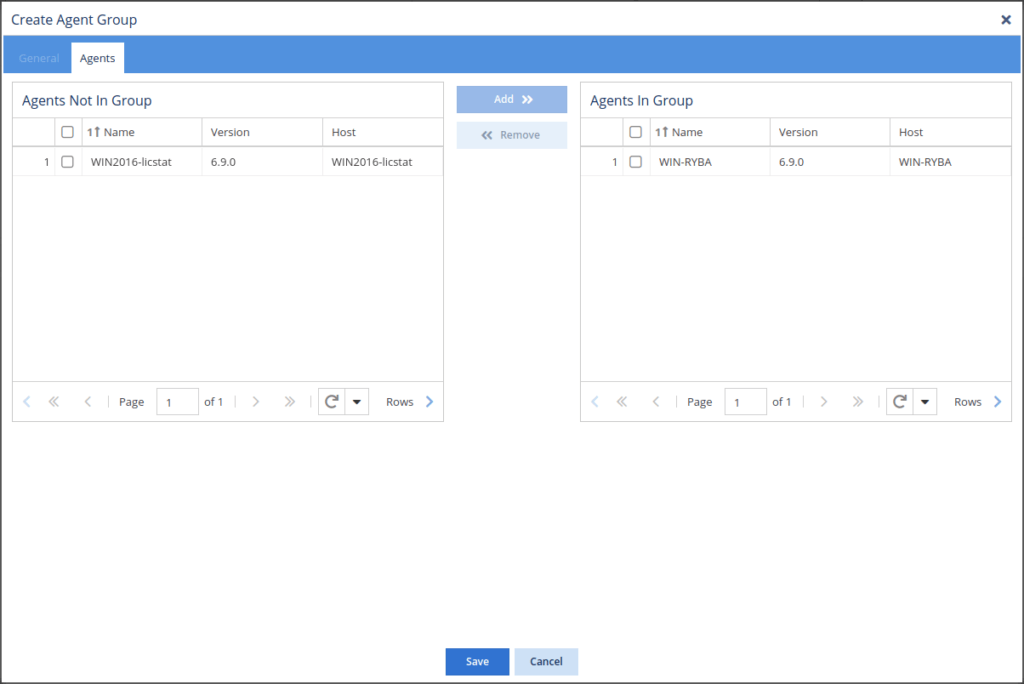
Set Up License Agents Groups in License Statistics
Once you have installed and connected all Agents to License statistics, create an Agent Group by going to Administration → Groups → Agents tab.
Once you’ve added all the agents into the new group, Save the group.
Set Up the Application to Be Monitored
Now that all Agents have been installed and added to groups, you now configure the application to be monitored on the end-user host. There are several options and scenarios you can set up that control how License Harvesting will be implemented for that application.
Here are the basic configuration steps:
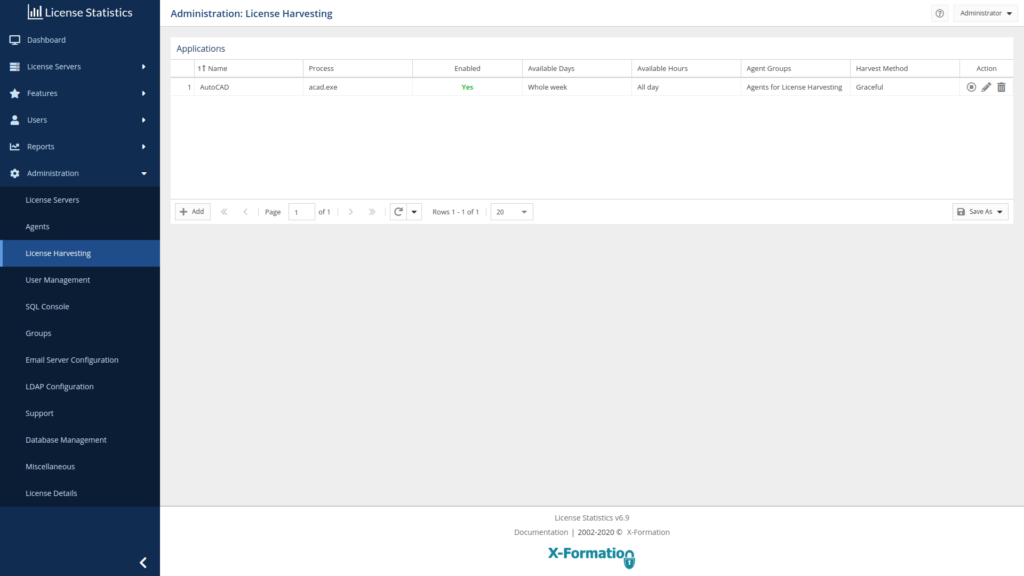
Go to Administration → License Harvesting and Add a new harvesting application. Give the scenario a name, enable it to monitor the Agents, and enter the name of the application process running on the end-user host.
Set up Activity Tracking parameters to establish what should be considered an idle state. You can specify an “Inactive User Duration” in seconds before Harvesting begins, or a “Minimum CPU Activity” percentage below which the application is considered idle and Harvesting is triggered.
(Optional) Set Working Hours during which the application can be used. If the application is used outside the defined days/hours, the Harvesting process is started. (24/7 is allowed by default, but you can easily adjust it for weekends and specific hours of the day.)
Set the parameters for how License Harvesting will be conducted: Set the parameters for user confirmation:
Confirmation Required: The end-user will be asked if the application should be closed due to idle state.
Confirmation Timeout: (Optional) The time in seconds after which User Confirmation will be considered as YES and the application should be closed. If you set no value, the User Confirmation dialog will remain until the user chooses.
Set the Release Method for the application:
Graceful: Close the application gracefully, leaving to the application the decisions about unsaved state questions or confirmations.
Graceful Wait Time: (Optional) The time in seconds after which the Agent will force the application to close; if not set, it will wait endlessly for the application to close itself.
Force: kills the application upon meeting your established criteria.
Select the Agent Groups to which the new License Harvesting parameters are to be applied.
Save your new License Harvesting configuration.
Automatic License Harvesting
The entire Harvesting process is automated. Each agent periodically connects to the License Statistics server to get the configuration. Should the end-user host lose connection with the server, Agent continues to operate with the last received configuration until the connection is reestablished.
The License Agent begins monitoring the application immediately after receiving its configuration from the License Statistics Server. It monitors the application process and checks user interaction and/or CPU usage.
Here’s what happens after a user who had checked out a license forgot to check it back in, instead, leaving for the day. The user left without saving their work.
The Agent detects that the application is idle based on configuration.
Harvesting begins. The user is prompted to either close the application or keep working.
After the User Confirmation Timeout elapses with no user response, the Agent continues to close the application.
The application is asked to close gracefully.
Since an unsaved document still remains open, the application asks if the user should save the state before closing.
After the Graceful Timeout period elapses with no response, the Agent escalates the application close method.
The Agent sends the signal to force the application to close.
The end-user host operating system kills the application.
When the application stops running, it is no longer connected to the license server. Based on your license server configuration, the license will be returned to the available license pool for access by other users in the company. When the user returns, they will have to check out a new license from the server (if one is available).
The beauty of the License Harvesting feature is that it does not depend on the license server having to monitor individual applications – Harvesting can be applied to all applications on the end-user host.
Put License Harvesting to Work for You
Contact our team for expert guidance on what License Statistics can do for you. And if you’re an existing License Statistics customer, you can get a free two-month trial to see how License Harvesting works in your environment. Call or email our sales team for details.
As always, the X-formation team is ready to help you get the most from your software investment.
Check the video we’ve put together on License Harvesting
The License Statistics Agent brings a new set of features to License Statistics designed to improve your ability to monitor and manage software usage throughout your organization. One of the new features addresses a major change Autodesk made to its licensing in conjunction with its shift to the cloud platform.
What you’ll learn in this video:
What the License Statistics Agent is and why it matters to your organization.
How the License Statistics Agent helps you monitor and manage the new Autodesk cloud licensing.
How the License Statistics Agent monitors and reports on Autodesk client application usage in real time.
Watch the video now to see yet another way x-formation is helping you get the most from your software investment.
August 10, 2020|Dawid Tadel|in category License StatisticsComments Off on Features and Enhancements in License Statistics v6.8
New License Statistics Agent administration features, display of Autodesk ID reservations in Reservation reports, API v2, user interface upgrades, and a new License Statistics Agents page lead the list of features and enhancements for License Statistics v6.8.
The v6.8 release of License Statistics introduces an administration and configuration tool for the License Statistics Agent, updates Reservation reports to display Autodesk ID reservations, and a variety of user interface upgrades and enhancements. The new release continues the introduction of tools designed to support the License Statistics Agent.
License Statistics Agent is a License Statistics add-on tool that enables client usage monitoring for software using locally running applications that must be tracked on the clients themselves. License Statistics Agent communicates between these applications and License Statistics, running as a service in the background.
License Statistics Agent is currently available only for Windows installations. In addition, License Statistics Agent currently supports monitoring only for Autodesk license usage.
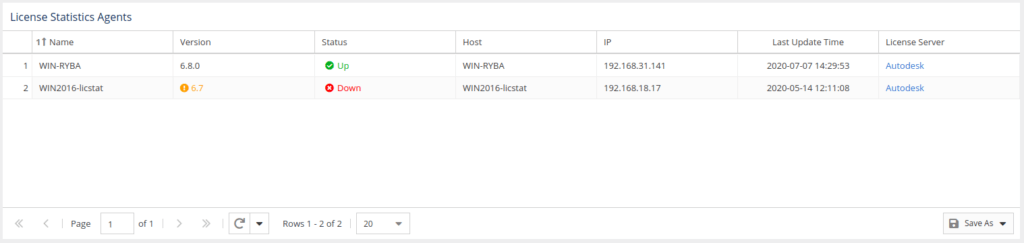
License Statistics Agents page
The License Statistics Agents page provides a list of all License Statistics Agents in use, and that status of each. The first version of License Statistics Agent supports the Autodesk client application monitoring. (See the documentation on Reviewing Licensing Statistics Agents for more information.)
The Agents page provides the following information about License Statistics Agents in use:
Name: By default, this is the host name, which can be edited using inline edit.
Version: Version of the agent service. This column shows a warning symbol if the agent version is older than the current License Statistics version.
Status: Status of license server. The status can be either Up or Down. A status of Down indicates that there was no data gathered during the last two reporting intervals.
Host: Host name of the machine running the agent.
IP: IP address of the machine running the agent.
Last Update Time: Last update time of the license server.
License Servers: A list of all license servers for which the agent provided data. Currently, this is limited to a single Autodesk license server. In future releases, this column may list multiple license servers supported by a single agent.
Autodesk Reservations in Reservations Reports for Autodesk Client Application
Autodesk reservations are now tracked in Reservation reports for the Autodesk client application. All License Statistics Reservation reports now reflect Autodesk client usage, including the following:
The License Statistics API has been greatly enhanced in the v6.8 release. It’s now much cleaner and easier to use. New endpoints have been implemented to make it even more extensive.
Note: Support for API v1 will be supported for a limited time. However, v1 is deprecated and support for it will be removed in the future. Please plan to update your use of the API for the new version.
See the following documentation updates for more details on what’s new in API v2:
We’ve also enhanced the License Statistics user interface to improve usability and application behavior. Of special note is that multi-column ordering is now available on all grids and in API v2. Check out the improvements, and please let us know what you think.
The X-Formation team is devoted to your success. If you have any questions, please contact support for answers.
July 12, 2020|Dawid Tadel|in category License StatisticsComments Off on Summary: Ongoing Management of Software Assets During the COVID-19 Crisis with License Statistics
In this final article addressing license management during the COVID-19 crisis, we summarize the ways you can use License Statistics to gain insight into license usage through regularly monitoring and managing license usage.
The COVID-19 pandemic continues to create difficulties for many companies as they keep business operations moving safely while adapting to new, remote ways of doing business. At X-Formation we’re proud to be able to help you maintain control of costs by better optimizing license usage.
Just as we were here to help your organization through the financial crisis of 2007 to 2009, we continue to work on your behalf through the COVID-19 pandemic. The key to managing software assets now is to watch borrowed license use as workers continue to work from home long-term, and as some return to the office itself.
The nature of work may have changed forever, but the ability to manage and optimize your software assets hasn’t. The tools you have at your disposal in License Statistics are exactly what you need to manage costs and keep your staff working.
In License Statistics, all current and real-time reports give you immediate insight into license utilization. The reports most useful for tracking purposes are:
The Feature Reservations History report can provide information about unconsumed reservations that could easily be used by other people. Use it in combination with the User Denials report for the same feature and time frame to get complete details.
You can use the Expiring Features report to see an overview of when features are expiring. This allows you to plan for (or even delay) future payments for the licenses until the expiration date gets closer.
Managing Borrowed Licenses
License Statistics administrators may find that adjustments to license behavior — such as the expiration time for borrowed licenses — will be necessary to ensure uninterrupted software use. Here are some easy ways to monitor borrowed license usage to ensure availability:
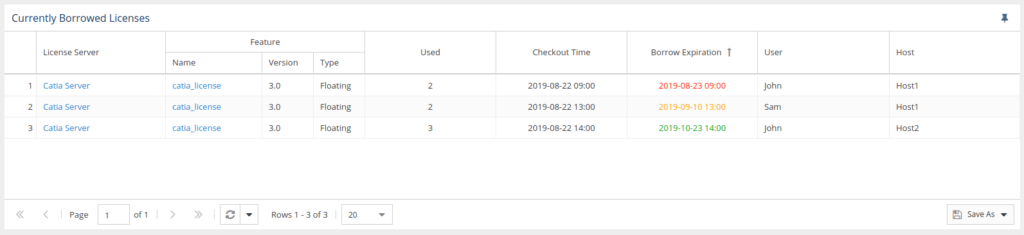
The Currently Borrowed Licenses report shows you the borrowed licenses for all features on one or all license servers. You can also drill into borrowed licenses on a specific license server. The report details the number of borrowed licenses used, checkout and borrow expiration times, and the user / host for each borrowed license by feature on the selected server (or servers).
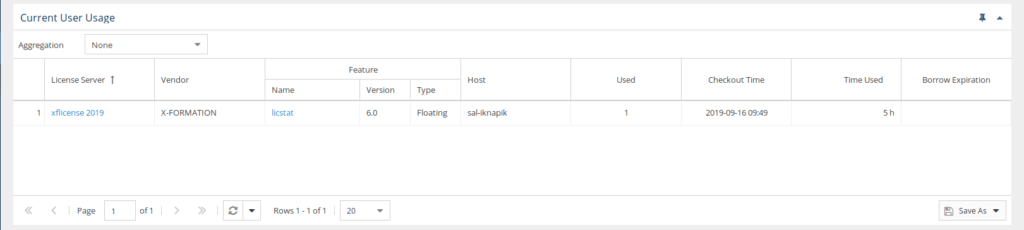
The Current User Usage grid includes information about a user or user group’s license usage, including expiration times for borrowed licenses, the license server, vendor, feature information, and host licenses where checked out from, the number of licenses used (which may be more than 1 in cases such as token licenses), the time the license(s) were checked out and the amount of time the license was used.
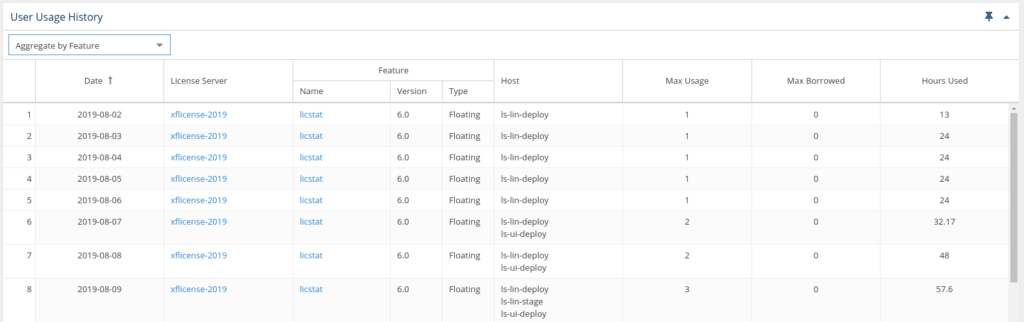
The User Usage History grid includes information about a user or user group’s historic license usage, including the license server, feature information, the host that licenses were checked out from, the maximum number of licenses borrowed (used), and the number of hours licenses were used.
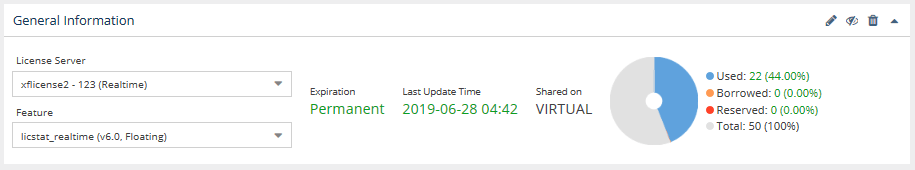
Another way to look at borrowed license usage is by feature. The Current Feature Usage report page shows the usage statistics for a selected feature. In a glance you can see a summary of feature usage information, including a current count of licenses used, borrowed and reserved; the total licenses available; and the feature’s expiration date and utilization percentage.
Stay Calm and Manage Your Licenses
We trust this information has helped you get better insights into your software assets and license usage. License Statistics enables you to maintain control of your business and continuously scale licenses up or down as your workforce changes.
The X-Formation staff reminds you they’re here for you whenever you need assistance. You can count on us. In the meantime, continue life’s best practices: Stay home, practice social distancing and cut down on your unnecessary licenses.
May 28, 2020|Dawid Tadel|in category License StatisticsComments Off on Managing Borrowed Licenses During the COVID-19 Crisis with License Statistics
In this third article addressing license management during the COVID-19 crisis, you’ll see how to use License Statistics to monitor and better manage use of borrowed licenses.
With more people working from home, and with no end in sight to the need for vigilance over COVID-19, you’re going to find that more and more users have borrowed floating licenses for use remotely. Some companies are already planning for long-term remote work to adapt to the radical changes in working environments. That means more borrowed license usage.
License Statistics administrators may find that adjustments to license behavior — such as the expiration time for borrowed licenses — will be necessary to ensure uninterrupted software use. Here are some easy ways to monitor borrowed license usage to ensure availability:
The Currently Borrowed Licenses report shows you the borrowed licenses for all features on one or all license servers. You can also drill into borrowed licenses on a specific license server. The report details the number of borrowed licenses used checkout and borrow expiration times, and the user / host for each borrowed license by feature on the selected server (or servers).
You may also find situations in which too many licenses have been borrowed by the same user on multiple hosts. You can immediately see where this is happening on the Current User Usage report and in the User Usage History report. The Current User Usage grid includes information about a user or user group’s license usage, including expiration times for borrowed licenses, the license server, vendor, feature information, and host licenses where checked out from, the number of licenses used (which may be more than 1 in cases such as token licenses), the time the license(s) were checked out and the amount of time the license was used. The User Usage History grid includes information about a user or user group’s historic license usage, including the license server, feature information, the host that licenses were checked out from, the maximum number of licenses used and borrowed, and the number of hours licenses were used.
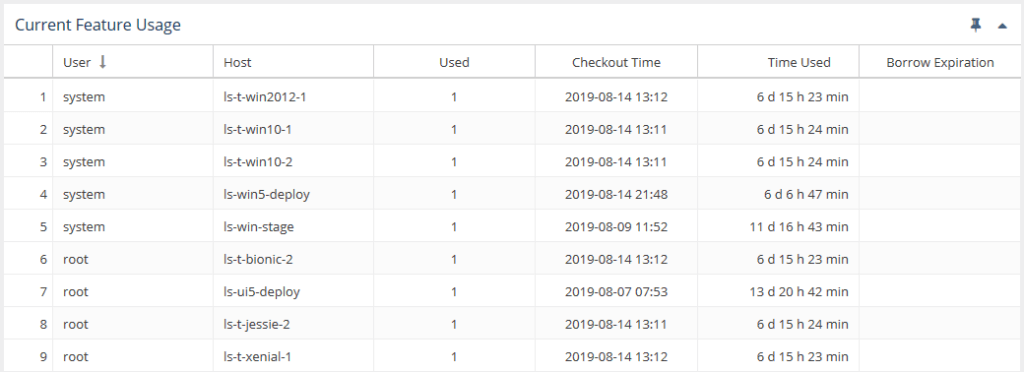
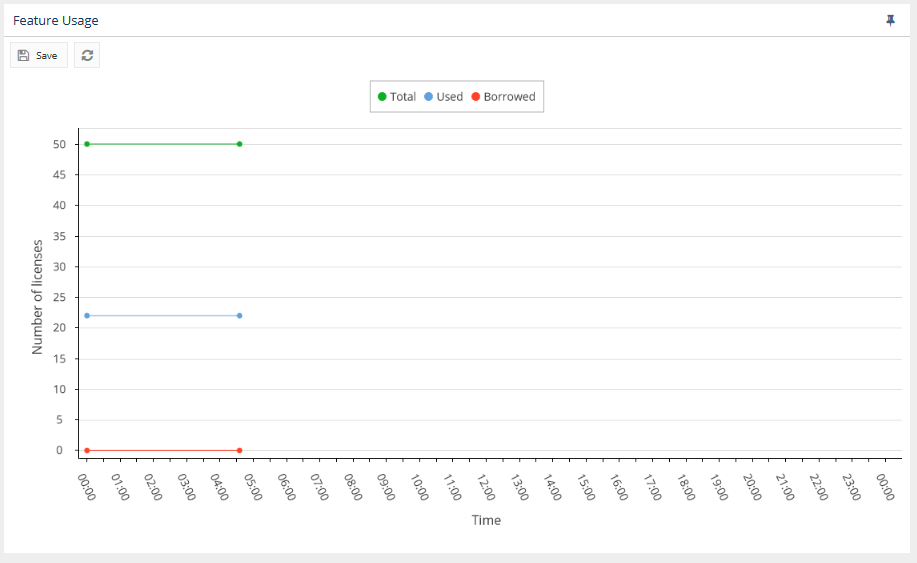
Another way to look at borrowed license usage is by feature. The Current Feature Usage report page shows the usage statistics for a selected feature. In a glance you can see a summary of feature usage information, including a current count of licenses used, borrowed and reserved; the total licenses available; and the feature’s expiration date and utilization percentage. The Current Feature Usage list includes the username and hostname of the machine on which the selected feature is checked out, how many licenses that user has checked out, the checkout time(s) and how much time has elapsed since checkout, and when the borrow time expires (for borrowed licenses). The Feature Usage graph gives you a picture of the number of licenses used throughout the day, making it easy to see borrowed license usage over time.
We believe that you should remain in control of your business. License Statistics enables you to do just that as you can continuously scale licenses up or down as your workforce changes.
In the light of the current situation we urge everyone to do what is necessary in the situation: Stay home, practice social distancing and cut down on your unnecessary licenses.