How to Use License Servers Usage Page

The License Servers Usage page, new with License Statistics v6.6, allows administrators to monitor statistics about each license server

The License Servers Usage report page gives administrators the ability to monitor statistics about how each license server is being used in real time. A usage chart gives you an overview of usage counts, and a usage grid provides usage details for each license server.

The information you get from the License Servers Usage report page can help you understand exactly how many users are using which license servers. You can actually see which servers have the heaviest use, helping you make better decisions about future hardware and network requirements.

You’ll find the License Servers Usage report in the Usage tab of the License Servers page, located under the Administration section in the left pane. (This page is visible only for License Statistics administrator users.)

The License Servers Usage Chart

(Available in v6.6 under the new licensing model only.) The Usage tab includes a License Servers Usage chart that allows you to view counts for Users, Features, or Hosts. You can sort by total or current usage. Control your viewing options using the Show and Sort by drop-down menus.

License Servers Usage grid

The License Servers Usage grid lists details about the number of features, users and hosts in the database for each license server. The grid provides the following information for each license server:

  • The number of features/users/hosts included in the last query.
  • The number of the users/hosts that were monitored by the associated license server only.
  • The number of all features/users/hosts monitored by the associated license server.

Hover over any number in the grid, and you’ll see a list of the users, hosts, or features included in that report count. In any such list you can edit the display name, display version, and description that appears in reports.

Refer to “Reviewing license server usage” for more details on using the License Servers Usage page.

Get to know License Statistics

Tracking Autodesk® Named User Licenses with License Statistics

Autodesk® is moving from network licenses to named user licenses starting August 7, 2020. License Statistics v6.7 introduces the License Statistics Agent in response.

Beginning August 7, 2020, Autodesk® will change its licensing model from network licenses to named user licenses. (See the Autodesk article “Transition to named user licenses” for details.) To support the new model, Autodesk introduced its cloud platform to manage licenses (https://manage.autodesk.com). 

How Autodesk’s Change Affects You

With named user licenses, Autodesk moves away from network licenses and, after a year, eliminates maintenance contracts for network licenses. It’s a difficult decision to make – trade in now, stay with network licensing without maintenance, or shift to perpetual licenses – also with no maintenance. Deciding to switch is about cost and your needs. Even if you retain network licensing with no maintenance, License Statistics will continue to support FlexNet (used by Autodesk network licenses).

Should you shift to named user licenses, you’ll no longer have a single source of usage data. You must monitor both the cloud service and the applications running on client hosts.

Here’s how License Statistics handles named user license monitoring.

How License Statistics Monitors Autodesk Named User Licenses

The v6.7 release of License Statistics introduces a new Autodesk cloud license manager type consisting of two independent data gathering methods:

  • HTTP monitoring of the Autodesk cloud platform (https://manage.autodesk.com) to gather general license and user data.
  • License Statistics Agent, installed on end-user hosts, to gather license usage statistics.

License Statistics Agent

This initial version of License Statistics Agent is the first iteration of our new long-term project that will significantly extend License Statistics capabilities. With this first version, you will be able to monitor Autodesk named user license usage directly on client hosts.

The Agent is a separate application you install independently from License Statistics directly onto client hosts. There, it gathers data about license usage – including username, hostname, and sessions where the application was running – and delivers it to the License Statistics application. The License Statistics Agent communicates between these applications and License Statistics, running as a service in the background.

License Statistics Configuration for Autodesk

You’ll provide the Autodesk administrator username and password during license server configuration in License Statistics. License Statistics will report the following:

  • The list of products the customer purchased.
  • The number of licenses for each product.
  • The list of users assigned to particular Autodesk licenses. These will be displayed in License Statistics in the form of reservations as of next release.

You’ll be able to see usage and quantity of Autodesk named user licenses on a single report.

(Note: License Statistics will continue support for FlexNet – used by Autodesk network licenses – as we move towards monitoring the Autodesk cloud licensing solution.)

For License Statistics Agent installation instructions, see “Installing and Configuring License Statistics Agent”. License Statistics Agent is available only with License Statistics v6.7 and the Licensing 2019 licensing model

We believe that you should remain in control of your business. License Statistics enables you to do just that so you can continuously scale licenses up or down as your workforce changes. As always, if you have questions or suggestions, get in touch with us!

Get to know License Statistics

How to Use the Feature and User Reservations Report Pages

The Feature and User Reservations report pages, new with License Statistics v6.5, provides a quick view into license reservations

The Feature and User Reservations report pages give you an overview of the License Reservations for selected users or groups, and for all reservations of a selected feature. 

Knowing how many licenses are actually in use gives you more control over denials, gaps in license usage and under-utilization of licenses. Reviewing the Feature and User Reservations reports help you understand situations such as users being unable to check out a license despite only 2 out of 10 licenses currently being in use. (See the documentation for more information about License Reservations in general and the license servers you can monitor.)

Read on to learn more about how to use the Feature and User Reservations Reports pages.

The Feature Reservations Report Page

You’ll find the Feature Reservations report page under the Features section in the left navigation pane. There you will see an overview of all reservations for the feature you selected. The General Information area at the top of the page includes identifying information for the feature and lets you select the license server and feature to view.

Feature Reservations grid

The Feature Reservations grid shows the reservation information for the license server and feature you selected.

The grid displays the following information:

  • The type of reservation.
  • The pattern used for the reserved licenses.
  • The maximum number of licenses reserved.
  • The number of licenses remaining.
  • The time the reservation became available for checkout.
  • The expiration time.
  • Whether the reservation is current or historical.
  • The last time at which the reservation was queried from the license server.

You can view a reservation history graph for any active or historical reservation, and get details for any active reservation.

See “Feature Reservations” in the documentation for details.

The User Reservations Report Page

You’ll find the User Reservations report page under the Users section in the left navigation pane. There you will see an overview of all reservations across all features and license servers for the user or user group you selected. The General Information area at the top of the page allows you to select the user or user group to view.

User Reservations grid

The User Reservations grid shows the reservation information for the user or user group you selected, based on the pattern gathered from the queried server.

The grid displays the following information: 

  • The Feature name, version, and type.
  • The type of reservation.
  • The pattern used for reserved licenses.
  • The maximum number of licenses reserved.
  • The number of remaining reservations of each type.
  • The time the reservation became active.
  • The time the reservation will expire.

See “User Reservations” in the documentation for details.

We believe that you should remain in control of your business. License Statistics enables you to do just that as you can continuously scale licenses up or down as your workforce changes. As always, if you have questions or suggestions, get in touch with us!

Managing Licenses During the COVID-19 Crisis with License Statistics

In this second article addressing license management during the COVID-19 crisis, we show you how to use License Statistics to gain useful insights into your software licenses – and the ability to control how those licenses are being used.

As the COVID-19 pandemic continues, companies find that settling into this “new normal” has its share of challenges. Tracking changes in license usage is key to maintaining operations and keeping costs down today. Here are a few tips for making the most of your software license investment by using the tools readily available in License Statistics.

  • As personnel shift or go on furlough, license utilization is likely to vary quite a bit as your company continues to adjust. For example, you’ll probably find that the number of unused licenses will suddenly grow with staff reductions and moves. You’ll find, too, instances where too many licenses are being used by the same user on multiple hosts. Where can you gather this information?In License Statistics, all current and real-time reports give you immediate insight into license utilization. The reports most useful for tracking purposes are:
  • Use the information License Statistics provides to predict future license needs based on historical reports showing real license consumption. For example, if Utilization for a period of time is lower than expected, the Usage History Comparison report can show you where to make adjustments. Other useful reports:
  • The Feature Reservations History report can provide information about unconsumed reservations that could easily be used by other people. Use it in combination with the User Denials report for the same feature and time frame to get complete details.
  • You can use the Expiring Features report to see an overview of when features are expiring. This allows you to plan for (or even delay) future payments for the licenses until the expiration date gets closer.

We believe that you should remain in control of your business. License Statistics enables you to do just that as you can continuously scale licenses up or down as your workforce changes.

In the light of the current situation we urge everyone to do what is necessary in the situation: Stay home, practice social distancing and cut down on your unnecessary licenses.

Managing Software Assets During the COVID-19 Crisis

With the COVID-19 crisis continuing to unfold there is enough to worry about. With License Statistics, managing your software assets doesn’t have to be one of them.

The COVID-19 pandemic has created a crisis for many companies as they work to keep business operations moving while at the same time maintaining a safe working environment. Changes in staffing resulting in layoffs, reduced hours, and remote work created new and unexpected consequences and a host of new problems for business owners.

Fortunately, you won’t have to worry about managing your software licenses if you’re a License Statistics customer.

We here at X-Formation, the creators of License Statistics, are here to help you get control of costs by better optimizing license usage. Our full staff is still hard at work on your behalf, ensuring the stability and utility of License Statistics to make sure you get through this crisis with the fewest difficulties possible. We were there in the financial crisis of 2007 to 2009, and are here now for you and your business. While working from home like most others we still stand by our commitment to make a great product which helps you in your daily life. Additionally we’re proud to serve several of the medical companies that are on the frontline of this crisis.

We listen to you and, based on your feedback, have built the tools you need to manage your software licenses. In the next few articles, we’ll show you how you can use License Statistics to know exactly where and when your licenses are being used so you can better track what you need and what you don’t.

We believe that you should remain in power of your business. License Statistics enables you this as you can continuously scale up or down those licenses as your workforce changes.

In the light of the current situation we urge everyone to do what is necessary in the situation: Stay home, practice social distancing and cut down on your unnecessary licenses.

Introducing DSLS Restricted Access Mode

License Statistics v6.5 now provides support for DSLS restricted access mode passwords

Many of you have been asking for DSLS restricted access mode support when configuring Dassault license servers. With License Statistics v6.5, you can provide a password for restricted access mode during DSLS configuration when adding or editing a Dassault license server.

Here’s how it works.

Entering a Restricted Access Mode Password When Adding or Editing a Dassault License Server

DSLS Restricted Access Mode

To enter a DSLS restricted access mode password when adding or editing a Dassault license server:

  1. To edit an existing license server, click the Edit icon in the Action column of the Realtime License Servers grid row for the license server you want to change. An Edit License Server dialog opens to allow you to change the existing settings for that license server
  2. Alternatively, to add a new license server, click Add at the bottom of the Realtime License Servers grid. An Add New License Server dialog opens to allow you to configure the new license server.
  3. As you complete the information in the Add New/Edit License Server dialog’s License Server tab, enter the DSLS restricted access mode password into the “Password” field.
  4. Proceed with configuring the license server.

See sections “Adding or editing a realtime license server” and “Realtime License Server settings” on the Adding and editing realtime license servers page for details.

Get to know License Statistics

How to View Usage History with Heat Maps

With License Statistics v6.5 you can view the Usage History Graph as a heat map in which Usage History values are represented as colors. The Usage History Heat Map provides a graphical representation of the number of licenses used by the selected user/user group for a specified time period. 

One of the tools introduced in License Statistics v6.5 is the Usage History Heat Map, part of the User Usage History page. The Usage History Heat Map can help you quickly identify trends in usage history.

Here’s how to use the Usage History Heat Map.

Viewing the Usage History Heat Map

To view a heat map, select a desired grouping in the User Usage History Settings area. The Heat Map for the desired grouping and time frame is the default visible chart. Click the “Show Line Chart” button at the top of the graph to display the line chart instead. (For details see the User Usage History page.)

Using the Heat Map

The Usage History Heat Map allows you to toggle between Used and Borrowed licenses. The value in each block of the heat map is the number of licenses used or borrowed by the grouping and time range selected in the Settings section at the top of the User Usage History page. The map’s X axis represents the grouping you selected, and the Y axis represents the features used by that grouping in the selected time range.

The darker sections reflect heavier license usage, while the lightest sections reflect lower usage. At a glance you can quickly see license usage trends by date range and license feature set. This intuitive display of statistical data can help you better understand how licenses and license features are being used so you can better plan for optimal usage and license distribution in the future.

Get to know License Statistics

Features and Enhancements in License Statistics v6.5

Features and Enhancements in License Statistics v6.5

Feature and User Reservations, User Usage History heat map chart, new License Servers Usage page lead the list of features and enhancements for License Statistics v6.5.

The v6.5 release of License Statistics brings both new features and customer-requested enhancements to further simplify your software license asset management tasks. Highlights of the new release include the new Feature and User Reservations pages, easy-to-read heat map charts on the User Usage History page, and the new License Server Usage page.

These features are available only with the new License Statistics licensing model.

Let’s dive in.

Feature Reservations Page

The Feature Reservations page provides an overview of all reservations for a selected license server and feature. You’ll find it under the Features section in the left navigation page. (See the documentation for Feature Reservations for more details.)

The Feature Reservations page provides a General Information grid and a Feature Reservations grid.

  • The General Information grid includes identifying information for the license server and feature. You can set the license server and feature of interest in this grid.
  • The Feature Reservations grid shows detailed information for the selected license server and feature.

You can add the Features Reservation grid to the dashboard for quick viewing. 

Once you’ve selected a license server and feature, click the chart icon under the Action column to see the associated Reservation History graph. If the reservation is active, you can also get more details in the Reservation Details section by clicking the View icon under the Action column.

User Reservations

The User Reservations page provides an overview of all reservations across all features and license servers for a selected user or group. You’ll find the User Reservations page under the Users section in the left navigation pane. (See the documentation for User Reservations for details.)

The User Reservations page, like the Features Reservations page, contains a General Information grid and a User Reservations grid:

  • The General Information grid lets you select the user or user group to view reservations for.
  • The User Reservations grid shows detailed information for a selected user or group, based on the pattern gathered from each queried server.

You can add the User Reservations grid to the dashboard for quick viewing.

User Usage History Heat Map

In License Statistics v6.5 you can now view the Usage History Graph as a heat map. Once you select a desired grouping in the User Usage History Settings area, clicking the “Show Heat Map” button at the top of the graph displays the heat map.

The heat map version of the chart allows you to toggle between used or borrowed licenses. The X axis of the heat map reflects the grouping you selected, and the Y axis reflects all the features used by the user or group in the selected time range. Where the axes overlap is the number of licenses used, and the background coloring corresponds with the scale.

Refer to the documentation for details on the User Usage History page.

License Servers Usage Page

The new License Servers User Page allows administrators to monitor statistics about how each license server is being used. You’ll find the License Servers Usage page under the Administration section in the left navigation pane.

Administrators can use the License Servers Usage grid to get details on the number of features, users, and hosts in the database for each license server. Hover your cursor over any number in the grid to see a list of users/hosts/features included in the reported count.

Of course, we’ve also enhanced a few things to improve usability and application behavior. To discover more about the new features and enhancements, consult the Release Notes for License Statistics v6.5.

Get to know License Statistics

Features and Enhancements in License Statistics v6.3 and v6.4

Customizable branding tools, interactive API documentation lead the list of features and enhancements for License Statistics v6.3 and v6.4.

The v6.3 and v6.4 releases of License Statistics bring both new features and customer-requested enhancements to further simplify your software license asset management tasks. Highlights of the new release include a new User Usage History report, customizable UI elements for branding, and interactive API documentation.

What’s New?

License Statistics v6.3 and v6.4 bring the following new features:

  • A new User Usage History report that allows you to get usage history for a selected user or group.
  • The ability to customize UI elements for branding purposes.
  • Interactive API documentation embedded in the user interface using Swagger (https://swagger.io)
  • Ability to group by year on the Usage Per User report.
  • The ability to delete old, unneeded data from the License Statistics database.

Most of these improvements come thanks to your feedback – your success is our success. The new features added in the v6.3 and v6.4 releases are highlighted below. (Refer to the License Statistics v6.3 and v6.4 Release Notes for a complete list of enhancements to existing features.)

Administration Groups

New User Usage History Report

We’ve been busy enhancing the User Usage History Report over the past few releases, starting with v6.2 in which we introduced the ability to view license usage history by Current Usage and Denials. With the v6.3 release, the User Usage History report now gives you the ability to view license usage history by a selected user or group (available only with the new licensing model). The report makes it easy to select the user/user group for which you want to view usage history and specify time intervals to include in the results.

To view the report, select the Usage History page under the Users section in the left navigation pane. Remember, you can also add the Usage History grid and graph to the License Statistics Dashboard for fast and easy tracking.

User Usage History

Customizable Branding of UI Elements

One of the big features you’ve asked for is the ability to apply your organization’s branding to the LIcense Statistics interface. With the new release you can now add your company logo to certain UI elements, display a custom favicon, and make other changes to reflect your corporate identity. Use the Branding section in the Miscellaneous page, located under the Administration section of the left navigation pane. (You must be an Administrator to make these changes.)

You can customize:

  • The application name displayed in the browser title, footer, exported reports, and email templates.
  • The logo image displayed on the login page, above the navigation pane, in email notifications, and in exported reports.
  • The favicon image.
  • Visibility of the footer containing the X-Formation logo and versions, displayed in the UI and in email notifications.

For details on customizing License Statistics and the requirements for logo images and favicons, refer to the License Statistics documentation.

Interactive API Documentation

For your quick and easy reference, you can now get interactive API documentation directly on the API page using the embedded Swagger application. The interactive documentation is always up-to-date, so you can set up API calls knowing you have the latest information.

The new interactive documentation makes API development even easier thanks to the following features:

  • Test and run examples directly from the License Statistics UI.
  • Get immediate access to all return codes and parameters.
  • See built-in examples of the types of calls you can make.
  • Simplified authorization requests: The API documentation tool automatically authorizes requests with the current user token.

The interactive API documentation contains endpoints related to all reports, as well as charts including user, license server, and features scope.

API Endpoints

Group by Year on the Usage Per User Report

The Usage Per User Report now gives you the ability to group reports by year. When you limit license usage information to a year, you’ll see usage within the selected year based on daily usage. Doing so gives you a bigger picture of high usage trends, helping you spot infrequent but important spikes in usage.

Delete Old Data from the License Statistics Database

Administrators are now able to remove data older than the previous calendar year from the License Statistics database. To do so, select the Database Management tab from the Administration page.

Data Removal

Data Removal

If, for example, the current date is February 5, 2020, you will be able to select dates starting January 1, 2019 and older only. (You cannot remove data from the current or previous calendar year.)

Things to remember:

  • Once you confirm deletion, License Statistics will schedule the deletion to occur when you restart it. (You can always cancel any time prior to restarting.)
  • Plan deletion carefully. The process can take hours to complete, depending upon the amount of data you select. No data is collected during the deletion process, so be sure to schedule the deletion during non-critical hours if possible.

Of course, we’ve also enhanced a few things on the back end to improve usability and application behavior. To discover more about the new features and enhancements, consult the Release Notes for License Statistics v6.3, v6.4, and v6.4.1.

Get the Data Your Way: The License Statistics API

Of course you know License Statistics delivers the data you need to control license and license server costs. But did you know you can also display all that great data in the BI dashboards and reports you already use every day?

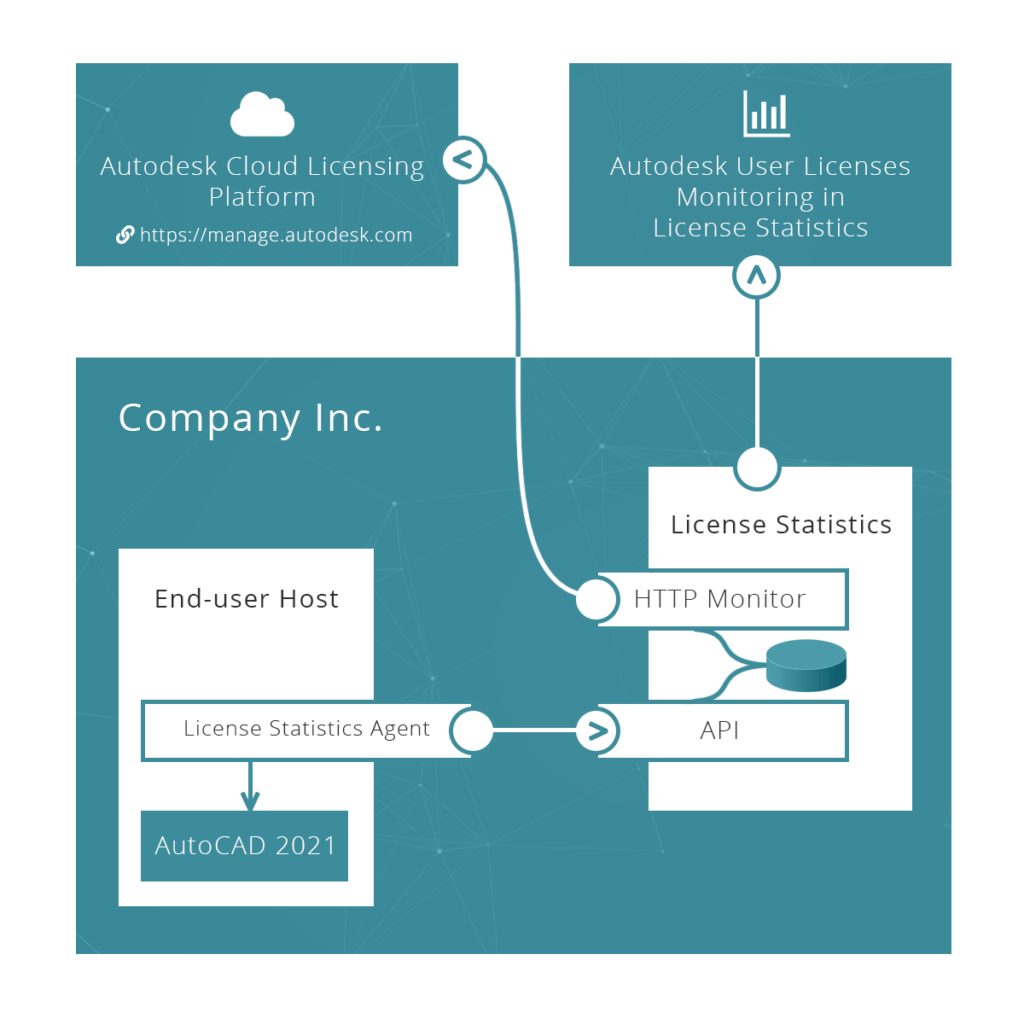
That’s right: The License Statistics API makes it easy to extract the data you need and integrate it into your own business processes. Display critical license data along with the other key indicators you track daily in reports, dashboards, and other BI tools. Use the API to automate report generation and make it readily available to your manager or a specific department in your organization.

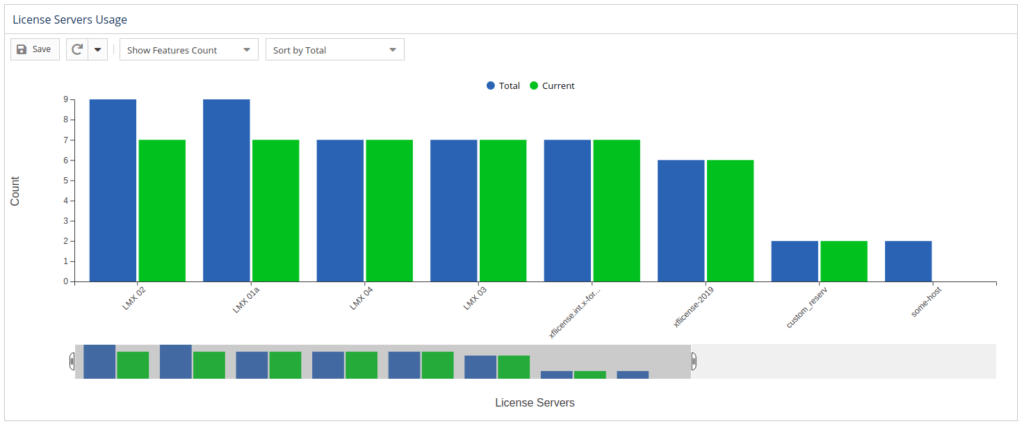
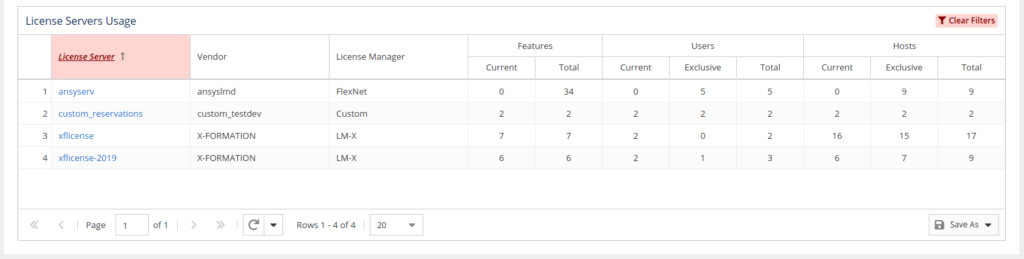
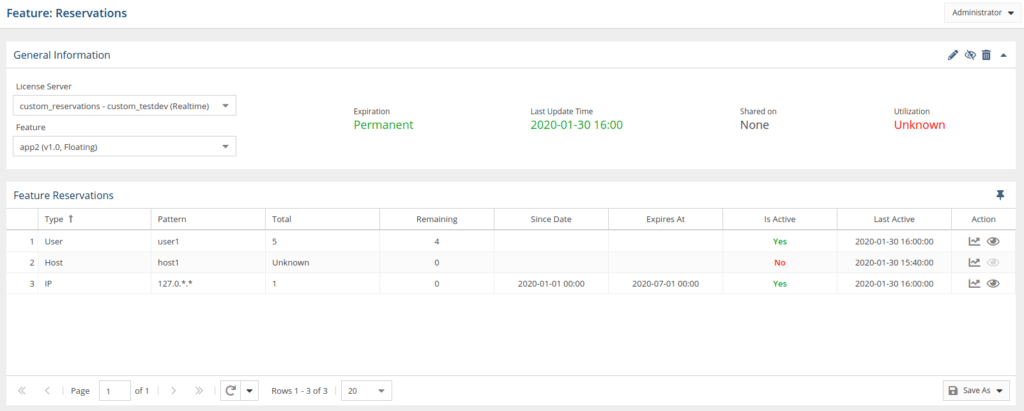
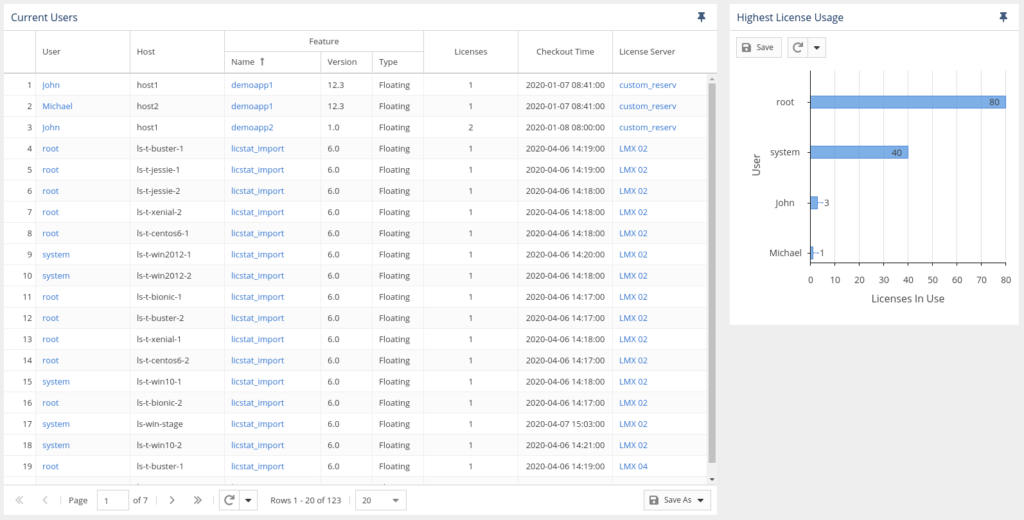
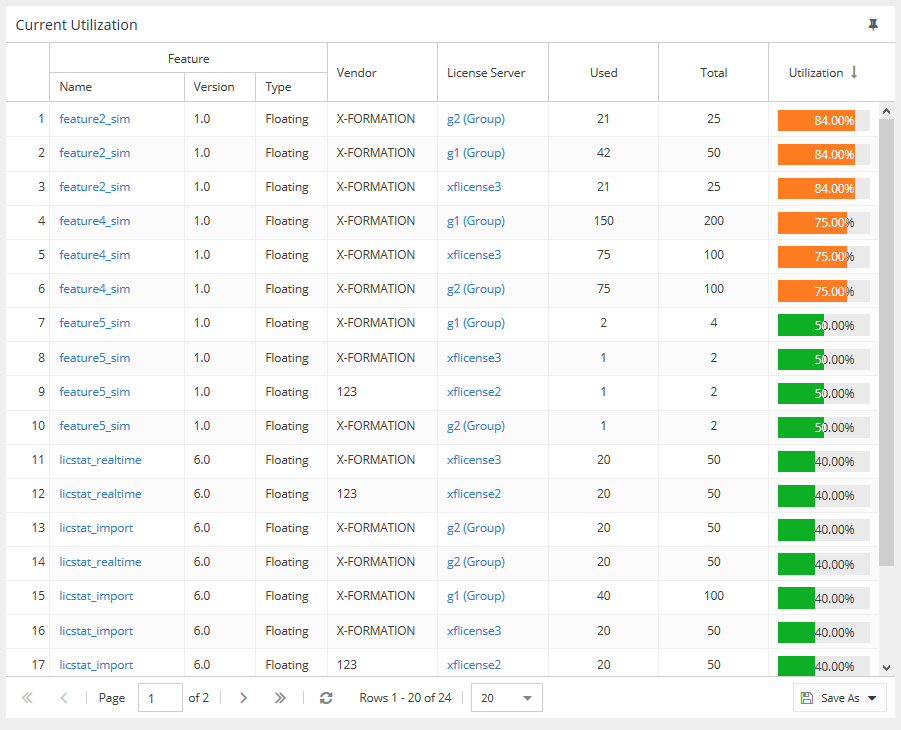
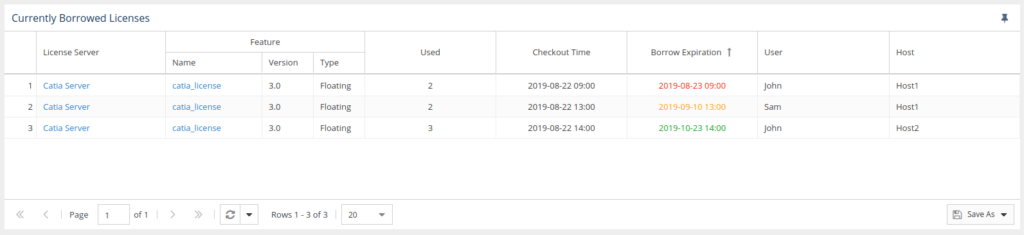
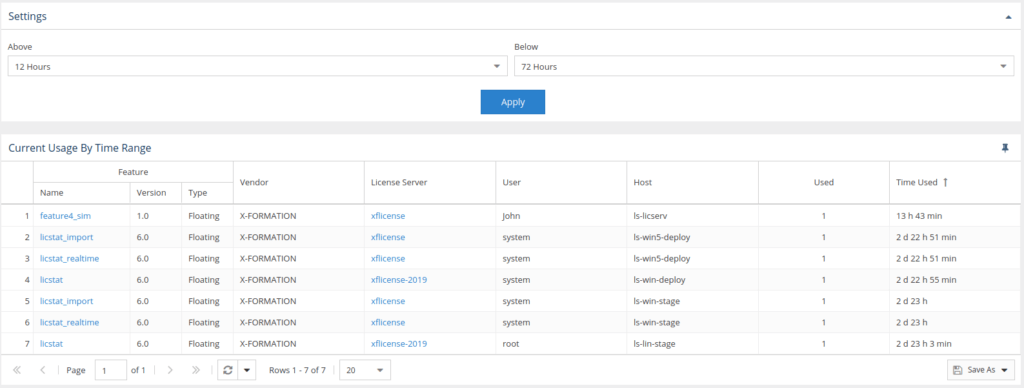
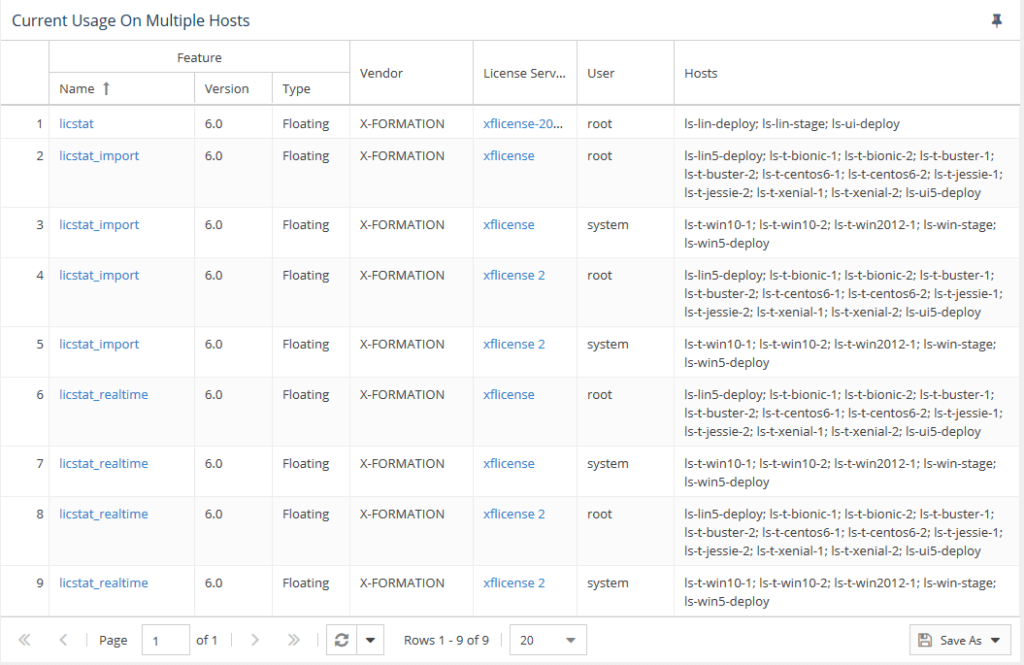
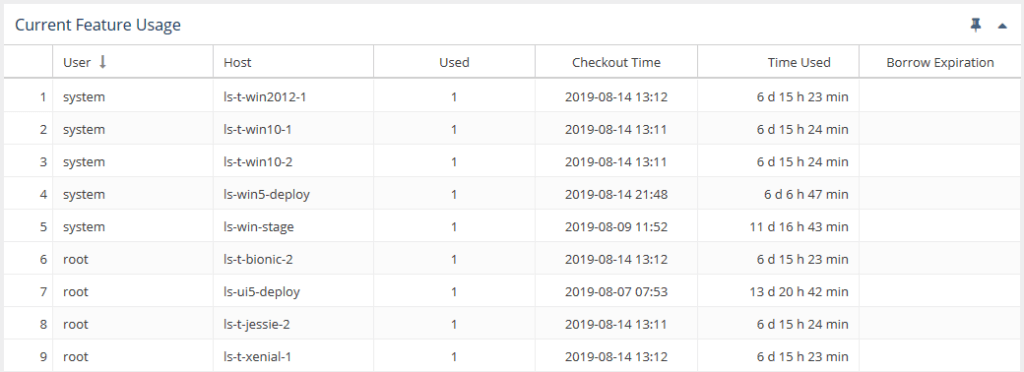
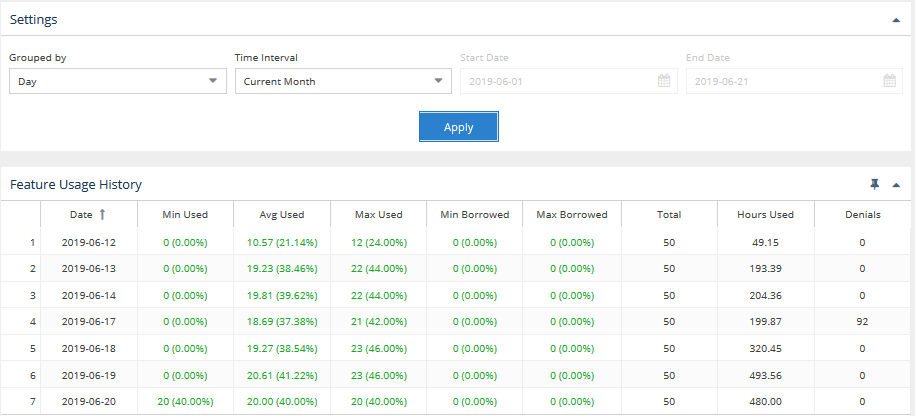
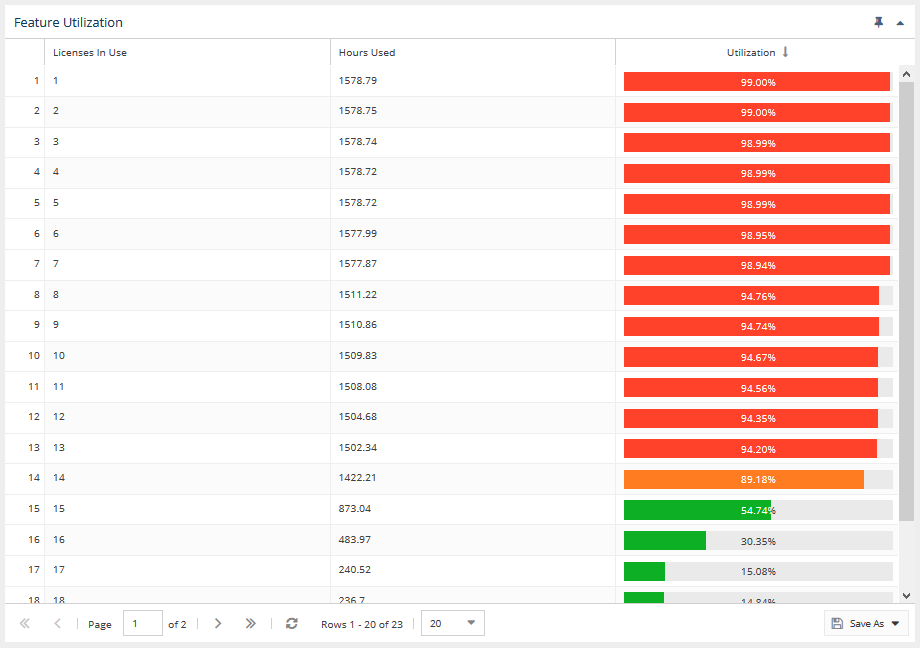
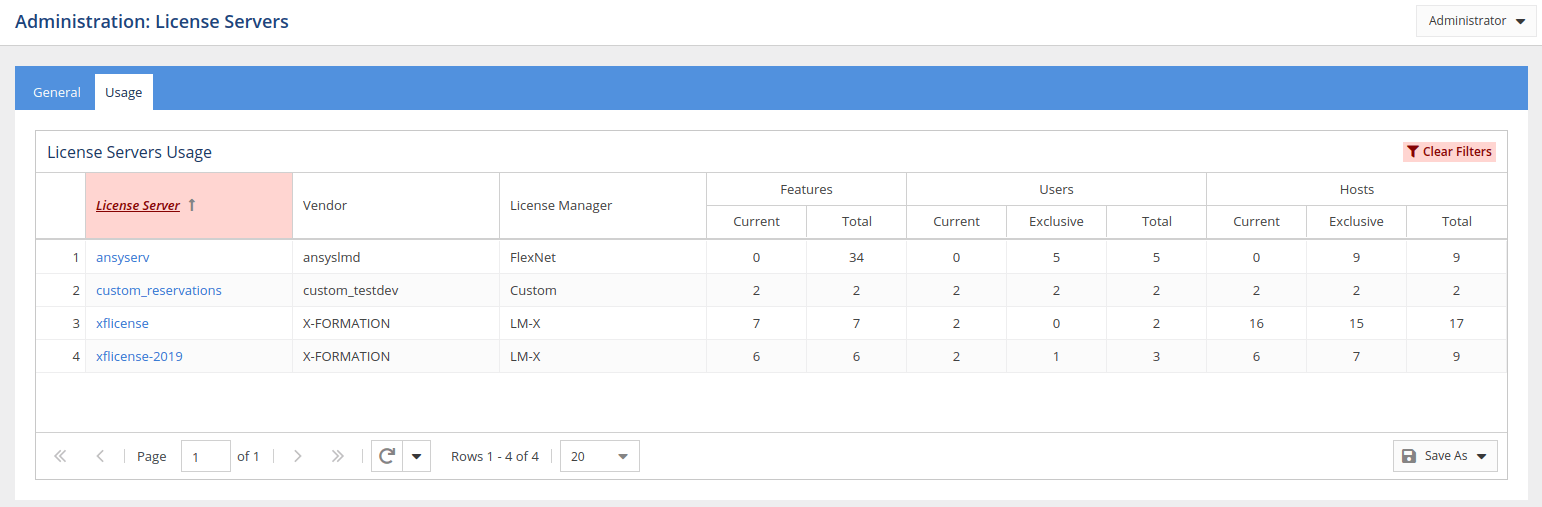
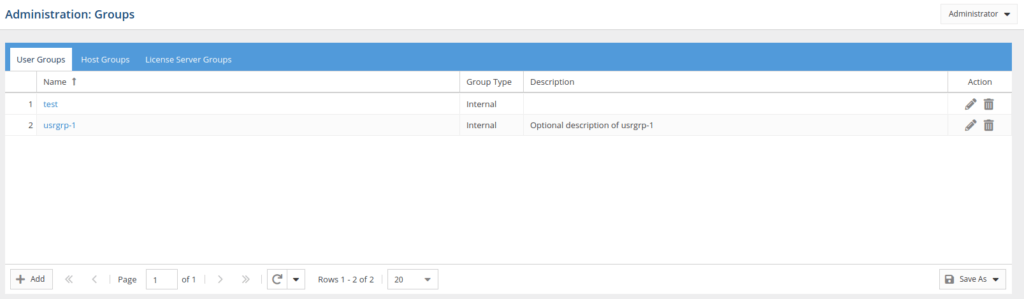
The License Statistics API is an invaluable tool for advanced users and systems integrators who want to create their own views into critical business data. The License Statistics UI shows you just what can be done with the API, as it uses the same API to display data in your web browser. 

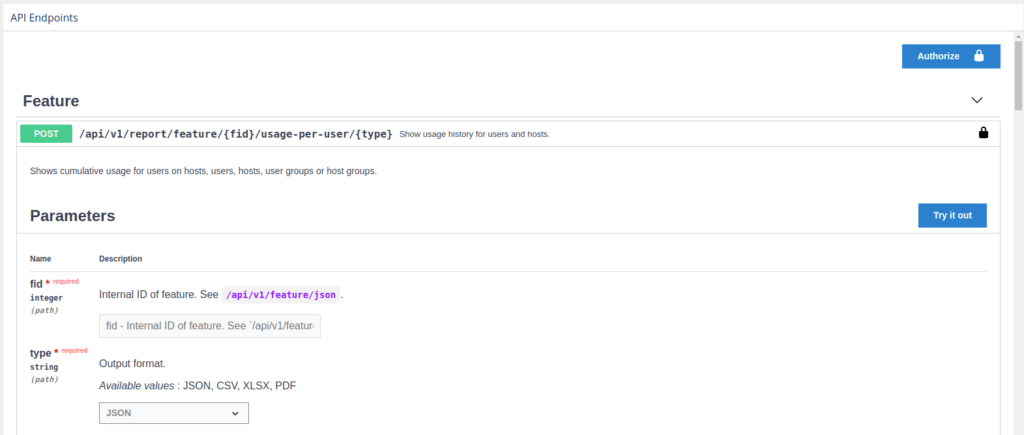
With the License Statistics v6.3 release, interactive API documentation is now embedded in the UI using Swagger (https://swagger.io/).

Getting Started with the API

The API gives you flexible, on-demand access to License Statistics data in an easy-to-extract format. You can request results in JSON, csv, PDF, or xlxs formats, so you have a wide variety of options for accessing and using the data. Use the API with your custom external applications, off-the-shelf BI tools, and reporting systems.

Getting started with the License Statistics API is as simple as enabling API access, generating a token, and making your first API request. Once you have enabled API access in your License Statistics account, you then generate an access token. 

Generating and Using API Tokens

API access tokens are unique identifiers associated with your account that are used to authenticate your data requests in the API. Tokens cannot be shared, so you’ll need to create a token for every user requiring access.

Once you’ve generated an API access token, you’ll add the HTTP header “X-Auth-token” to every request you make. Make requests directly using your web browser, or use an HTTP client like cURL to get the data in a variety of useful formats. Here’s a cURL example:

curl -H "X-Auth-token: token" "http://yourdomain/url-to-api"

Making API Requests

A basic API request uses the GET method to pass report parameters in a query string. The basic API request looks like this:

curl -H "X-Auth-token: token" "http://yourdomain/url-to-api?parameter=value&parameter2=other_value"

(“yourdomain” is the URL on which License Statistics v6.3 is installed.)

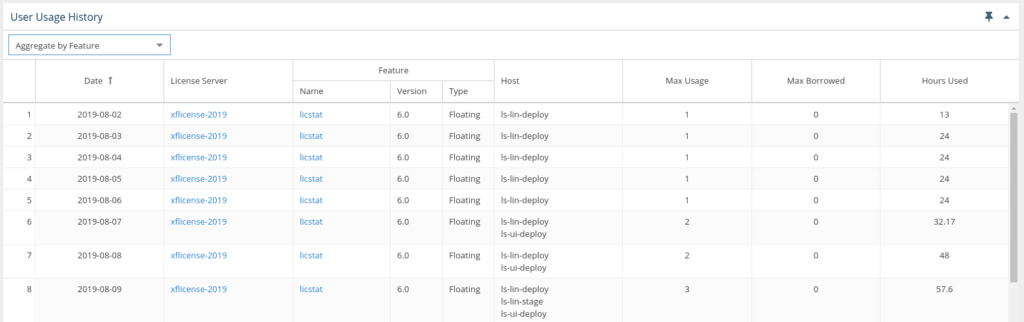
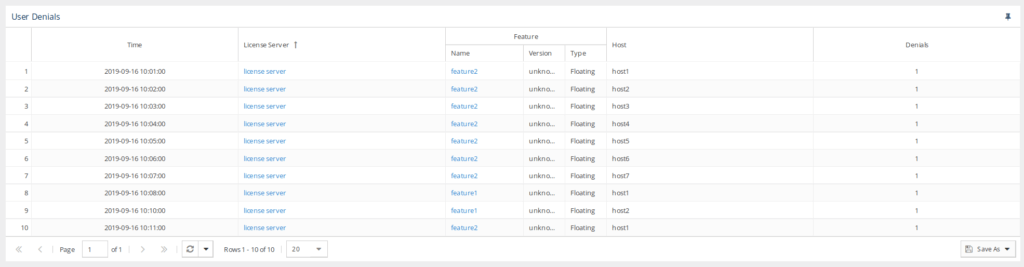
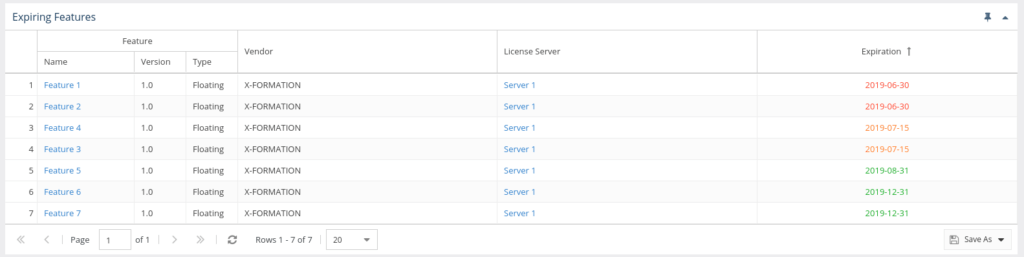
Any data you can see in the License Statistics UI can be accessed using the API and brought into your reporting tools. There are 18 API endpoints provided by License Statistics, each of which delivers specific license usage metrics.

Useful Examples

Example: Return a list of all features recognizable by License Statistics

The cURL command:

curl -H “X-Auth-token: token” “http://yourdomain/api/v1/feature/csv

will return a csv format file containing one row for each feature recognizable by License Statistics.

Example: Return a list of feature information filtered by name and version, output to csv format

The cURL command:

curl --data "filter=[{\"type\"=\"string\", \"field\"=\"fn\", \"value\"=\"abc\"}, {\"type\"=\"string\", \"field\"=\"fv\", \"value\"=\"2.1\"}]" -H "X-Auth-token: token" "http://yourdomain/api/v1/feature/csv"

will return a csv format file containing one row for each feature, filtered by name and version.

Example: Return information in json format for a feature with an ID of “1”.

The cURL command:

curl --data-urlencode "filter=[{\"type\"=\"numeric\", \"field\"=\"fid\", \"comparison\"=\"eq\" \"value\"=\"1\"}]" -H "X-Auth-token: token" "http://yourdomain/api/v1/feature/json"

will return a json file containing the information about the specified feature.

Conclusion

The License Statistics API is an easy-to-use tool for integrating License Statistics data into your own business processes. Ready to get started? Go to the “Using the License Statistics API” section of the online documentation for complete details.