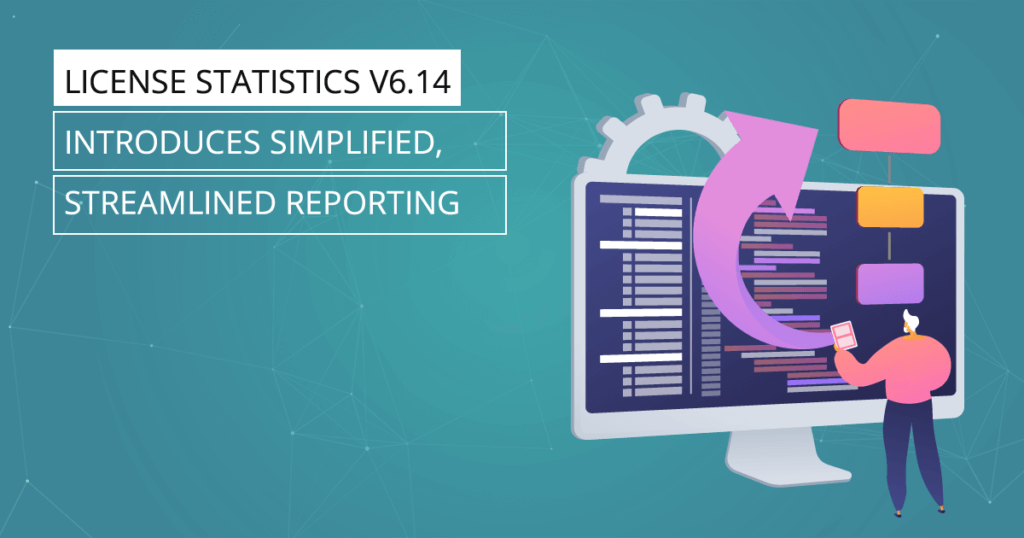
November 19, 2021|Gabrijel Zelic|in category License StatisticsComments Off on License Statistics v6.14 introduces simplified, streamlined reporting
With License Statistics version 6.14, we’re making your life even easier, with simplified, streamlined reports that more clearly divide realtime and historical statistics and reduce the number of reports, while still providing all the information you need to make wise decisions when it comes to license management.
The improvements to License Statistics reports add up to time savings and enhanced understanding, helping you to:
Clearly communicate realtime and historical usage throughout your organization with clearly delineated, focused feature and user reports
Cut down on time spent reviewing data with fewer reports
More easily focus in on the statistics that are most important to your organization to gain understanding of which licenses can be optimized to reduce costs
We understand that regardless of the benefits reaped when changing the user interface of an application you’ve gotten used to, getting accustomed to a shift can take time. To help you with the learning curve, we’ll be maintaining a legacy navigation menu, which you can find at the bottom of the regular menu, for the next few releases of License Statistics. Simply click on the link you were using with previous releases, and you’ll be automatically routed to the new page, with all settings adjusted to show the details you’re looking for.
Our goal is to continuously improve License Statistics in ways that are beneficial for you and directly address the feedback you give us. We’d love to hear how you like the new License Statistics reporting structure and the many other new features and enhancements we’ve delivered with License Statistics v6.14! As always, please feel free to contact support@x-formation.com with any questions. We’ll be delighted to serve you.
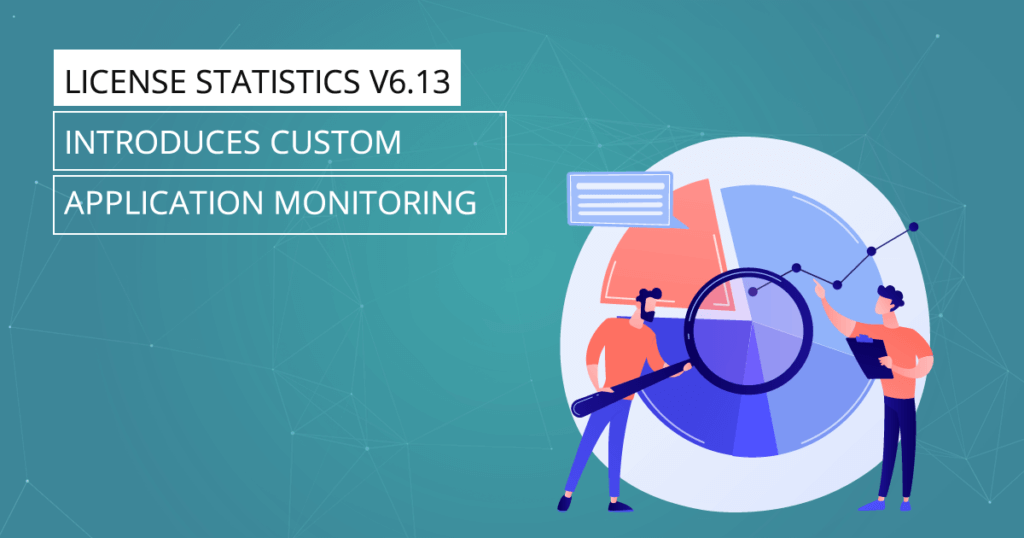
September 7, 2021|Gabrijel Zelic|in category License StatisticsComments Off on License Statistics v6.13 Introduces Custom Application Monitoring
With the introduction of License Harvesting in our previous release of License Statistics, we expanded the capabilities of License Statistics to be able to monitor applications in order to detect and automatically release idle licenses, cutting down on underutilized licenses and associated costs. So why not take it a step further and deliver statistics about the applications being monitored?
With our newest development, Custom Application monitoring, we’ve done just that, evolving License Statistics from a tool limited to monitoring license servers to a system that can monitor and manage application usage. With the combination of Custom Application monitoring and License Harvesting (which can optionally be used for any monitored application), License Statistics now offers a complete solution for monitoring, tracking, reporting and managing usage of any application—even those without a license server or log file—across your entire company.
When a user starts up an application configured for Custom Application monitoring, License Statistics Agents gather the application’s usage information, such as user and host names, time and duration of usage, number of instances used, etc. The usage data is passed along to License Statistics for presentation in its usual reports, with each instance represented as a used license, regardless whether the application is licensed.
Custom Application monitoring makes it easy for your company to stay on top of:
Who is using the application, and where and when it’s being used
How often your company is using the application overall, so you can eliminate software that’s not being used
Whether the application is being used according to your company’s set rules; for example, limits based on working hours (used in combination with License Harvesting, you can even force an application to be unavailable outside of specified hours)
What’s more, setting up Custom Application monitoring is a breeze. See the License Statistics documentation for complete details, and as always, please feel free to contact support@x-formation.com with any questions. We’ll be delighted to serve you.
The past 12 months have seen major upgrades and enhancements in License Statistics, including powerful new features and redesigned monitoring tools for increased control and usability. Here’s why you should be using the latest version of License Statistics.
Over the last year, we’ve delivered important updates and enhancements to License Statistics to help you get even better control over your software license budget. The latest version of License Statistics includes:
License Harvesting with automatic license release.
The License Statistics Agent, enabling new features such as Autodesk named user license tracking.
Feature and User Reservations.
API enhancements.
New and enhanced reporting tools.
Here’s what you need to know about the key features released in the past year.
License Harvesting with Automatic License Release
License Harvesting helps you eliminate the extra costs associated with purchasing spare licenses by monitoring users’ machines to see when licenses are unused (e.g. due to meetings, coffee breaks, etc.). Every company has peak days when the highest number of licenses are used. License Harvesting helps you monitor and respond to such peaks by reducing idle license consumption and automatically return those licenses to the available pool.
Automatic remote license release for LM-X and Flexnet license servers was introduced in License Statistics v6.10. This gets idle licenses back into the available license pool just after the Agent has closed the end-user application. No more waiting or manual intervention required – simply set it and forget it.
License Statistics Agent is a License Statistics add-on tool that enables client usage monitoring for software using locally running applications that must be tracked on the clients themselves. License Statistics Agent communicates between these applications and License Statistics, running as a service in the background.
License Statistics Agent currently supports monitoring for Autodesk license usage and Autodesk named user licenses, and is currently available for Windows installations.
Customer enhancement requests are one of our top priorities. Several customers had requested a way to view User and Feature reservations to further simplify software license asset management tasks. The User and Feature Reservations pages were the result.
The User Reservations page provides an overview of all reservations across all features and license servers for a selected user or group. You’ll find the User Reservations page under the Users section in the left navigation pane. (See the documentation for User Reservations for details.)
The Feature Reservations page provides an overview of all reservations for a selected license server and feature. You’ll find it under the Features section in the left navigation page. (See the documentation for Feature Reservations for more details.),
API Enhancements
Not only did we release a significant update to the License Statistics API with API v2, but we released the first version of API v3.
With API v2 came enhancements making it much cleaner and easier to use. New endpoints were implemented to make it even more extensive. The API v3 release lays the groundwork for future API enhancements and releases. It includes extended reports that allow extended selection of all license servers and features.
See the API documentation and interactive API tool documentation for more information.
New and Enhanced Reporting Tools
We were also quite busy this past year building new reporting tools and enhancing / extending current ones.
User Usage History report now gives you the ability to view license usage history by a selected user or group (available only with the new licensing model). The report makes it easy to select the user/user group for which you want to view usage history and specify time intervals to include in the results.
We are devoted to simplifying your license administration tasks through detailed reporting and complete automation of routine tasks – including recapture of idle licenses that would otherwise cost you hundreds of lost productivity hours every month.
As always, please contact support@x-formation.com with your questions. We’ll be delighted to serve you.
LuK leverages License Statistics to reduce software license costs by analyzing floating versus single license use provided by License Statistics comprehensive data gathering solution.
Client: LuK Problem: High Software License Costs Solution: License Statistics
Problem
LuK, a member of the Schaeffler Group, is an renowned manufacturer of clutch and transmission systems, torque converters, and dampers for cars and tractors. One in every four new cars produced in the world carries a LuK clutch.
Founded in 1965 and headquartered in Buhl, Germany, LuK Has more than 9,500 employees at 18 sites around the world, producing 14 million clutches, 4 million lock-up clutches, and 5 million dual mass flywheels.
The Schaeffler Group is comprised of the well-known brands LuK, INA, and FAG. It is a leading manufacturer and supplier of ball and roller bearings, clutch and clutch releasing systems, and engine and transmission components.
LuK not only produces automotive hardware. Its 50-person software engineering team builds software for transmission technology using such specialized software tools as MKS, ETAS, Doors, Matlab, and Tricore. IT Coordinator Oliver Winkler wanted an accurate picture of floating versus single license usage to know what mix of licenses they really needed.
How LuK Approached It
X-Formation offered LuK a trial period to determine whether License Statistics would solve its business problems. “The trial was easy-going and we saw a lot of impressive new features, which led us to the decision to invest in it,” said Winkler. “The Web-based standard reports, easy installation, and straightforward configuration were what sold us on the product.”
After only six months’ use of License Statistics, Winkler had collected enough statistical data to precisely identify which software tools could be covered by floating licenses and which needed single licenses to support power users.
What It’s Like Now
“We were able to achieve significant license cost savings by adjusting the number of floating licenses,” Winkler added. “At the same time, I was able to quickly and in accurate detail see what licenses were required at any given time to prevent development delays.”
Thanks to License Statistics, LuK now effectively monitors its license usage to accurately plan license purchases while avoiding development process disruptions.
Winkler concluded, “We have used License Statistics for evaluating our software tool licenses. We have never experienced a problem with it and the level of support is very good.”
Leitner Technologies boosts productivity, reduces licensing costs thanks to effective license management solutions enabled by License Statistics.
Client: Leitner Technologies Problem: Low Productivity and Out-of-Control Cost of CAD/CAM/CAE Software Licenses Solution: License Statistics
Problem
Leitner Technologies, established in 1888, is one of the leading manufacturers of ropeways, snow groomers, wind turbines, and urban transportation systems. Leitner has approximately 130 CAD Workplaces supporting 2D/3D CAD production, and uses a Product Lifecycle Management (PLM) System for collaboration. Most CAD licenses are shared network licenses, with 3D CAD licenses being the most expensive.
Because licenses were being purchased ad hoc to cover productivity problems caused by inconsistent access to critical software. Frequent, small purchases were expensive and caused budgeting challenges.
“Our license purchases were reactive,” said Moritz Amort, Leitner IT Engineer. “We bought additional licenses when users started complaining about license shortages, or we bought a bundle because a certain number of additional Workplaces had to be installed,”
Leitner discovered the source of the problem: They had no means to optimize and effectively manage their shared network applications while meeting user demand for access. Complicating matters, the company lacked the ability to appropriately budget and distribute licensing costs based on the needs of each of their business divisions.
How Lietner Approached It
At first, Leitner was forced to estimate how many licenses each division needed based on the number of installed clients for that division. Because not all clients had the same demand for licenses or usage requirements as others, the license partitioning scheme was inefficient and more costly than it should have been.
Seeking a full-featured and affordable license management solution, Leitner evaluated X-Formation’s License Statistics monitoring software. It surpassed Leitner’s expectations, Amort explained. “We chose License Statistics over the competition because the software met all of our requirements right out of the box.”
Once it put License Statistics into production and began monitoring actual license usage throughout their divisions, Leitner was pleased with achieving an effective license management solution that met all their needs. “Unlike our past reactive license purchasing practices,” Amort continued, “License Statistics now makes it possible for us to monitor our license usage over the year so we react proactively to anticipated license shortages. License Statistics enables us to buy additional licenses right when we need them, saving on license and maintenance costs, as well as minimizing the troubles of license shortages.”
What It’s Like Now
Not only did License Statistics ensure Leitner always had sufficient licenses at the best cost, but it solved the problem of accurately determining per-division costs. Amort said, “With License Statistics we can now monitor the real usage of each license for every user and partition the costs in a more realistic and fair way.”
License Statistics solved Leitner’s issues surrounding both license purchasing and cost allocation. The company can ensure its users are optimally productive at the lowest cause thanks to more effective and accurate planning made possible by License Statistics.
Amort concluded, “We have been fully satisfied with License Statistics. Not only does the software solve our business problems, but the support during and after the trial period and the documentation are great.”
May 12, 2021|Gabrijel Zelic|in category License StatisticsComments Off on License Statistics v6.12 Introduces API v3, Enhanced UI Capabilities
First release of License Statistics API v3, enhanced UI responsive design, and ability to control user session length among the new features and enhancements included in License Statistics v6.12.
The License Statistics v6.12 release continues adding new features and enhancements to the administration UI, and brings with it the first release of the latest License Statistics API. New features and enhancements include:
Support for remote monitoring of CodeMeter Network License Server.
The ability to control user license session length under Administration.
First release of License Statistics API v3.
New and enhanced UI features:
The ability to maximize content such as grids and charts to take up the full size of the application window.
The ability to select all license servers and features on the License Servers – Current Usage report.
Improved UI responsive design.
Before upgrading to License Statistics v6.12, ensure your environment meets the following requirements:
As of Java JDK v16, the deprecated protocols TLS 1.0 and 1.1 are no longer supported.
The minimum supported version of MySQL server is v5.7.28.
License Statistics API v1 was deprecated as of License Statistics v6.8 and is being removed in the current release. Use the stable API v2 instead.
Details on these new features and enhancements are provided below. For complete information on all features, refer to the License Statistics v6.12 Release Notes and associated v6.12 documentation.
Remotely Monitoring CodeMeter License Manager
License Statistics v6.12 now enables you to gather usage statistics on the CodeMeter license manager using remote data sources.
As we learn of new and popularly used license managers, trust us to give you the support you need for them. See the License Statistics documentation for currently supported license managers.
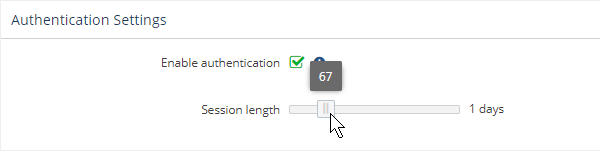
Setting User License Session Length
The ability to set user Session length is now available in License Statistics v6.12. You can set a maximum license session length when you add or edit a user and user authentication is enabled (the default).
Use the “Session length” slider on the User Management page in the Authentication Settings section to set the number of days that the session will last after users log in. The session length defaults to 1 day and has a maximum of 356 days. The session length you set is saved automatically.
The first release of API v3 includes extended reports that allow extended selection of all license servers and features. The following reports are affected:
Features – Usage History
Features – Current Usage
Features – User History
License Servers – Current Usage
NOTE: We’ve provided this first API v3 release to lay the groundwork for future API features and enhancements. It is still under development and we reserve the right to release breaking changes as the API continues to evolve. For production environments we recommend using the stable API v2 release.
User Interface Enhancements in v6.12
Several new user interface features and enhancements have been added in the License Statistics v6.12 release.
You can now maximize content such as grids and charts to take up the full size of the application window for a better view.
Most content can be expanded to take up the entire License Statistics application window by clicking theexpand icon at the upper right corner of the page. Maximizing the content is particularly useful for viewing reports that have a large amount of data, more easily viewing data on a phone or tablet, or setting the view up for a screen capture.
When you expand content to maximum size, the navigation panel and other content of the page, such as selection controls, will not be visible. To return the page to its normal layout, click therestore icon at the upper right corner of the page, or press Esc on your keyboard.
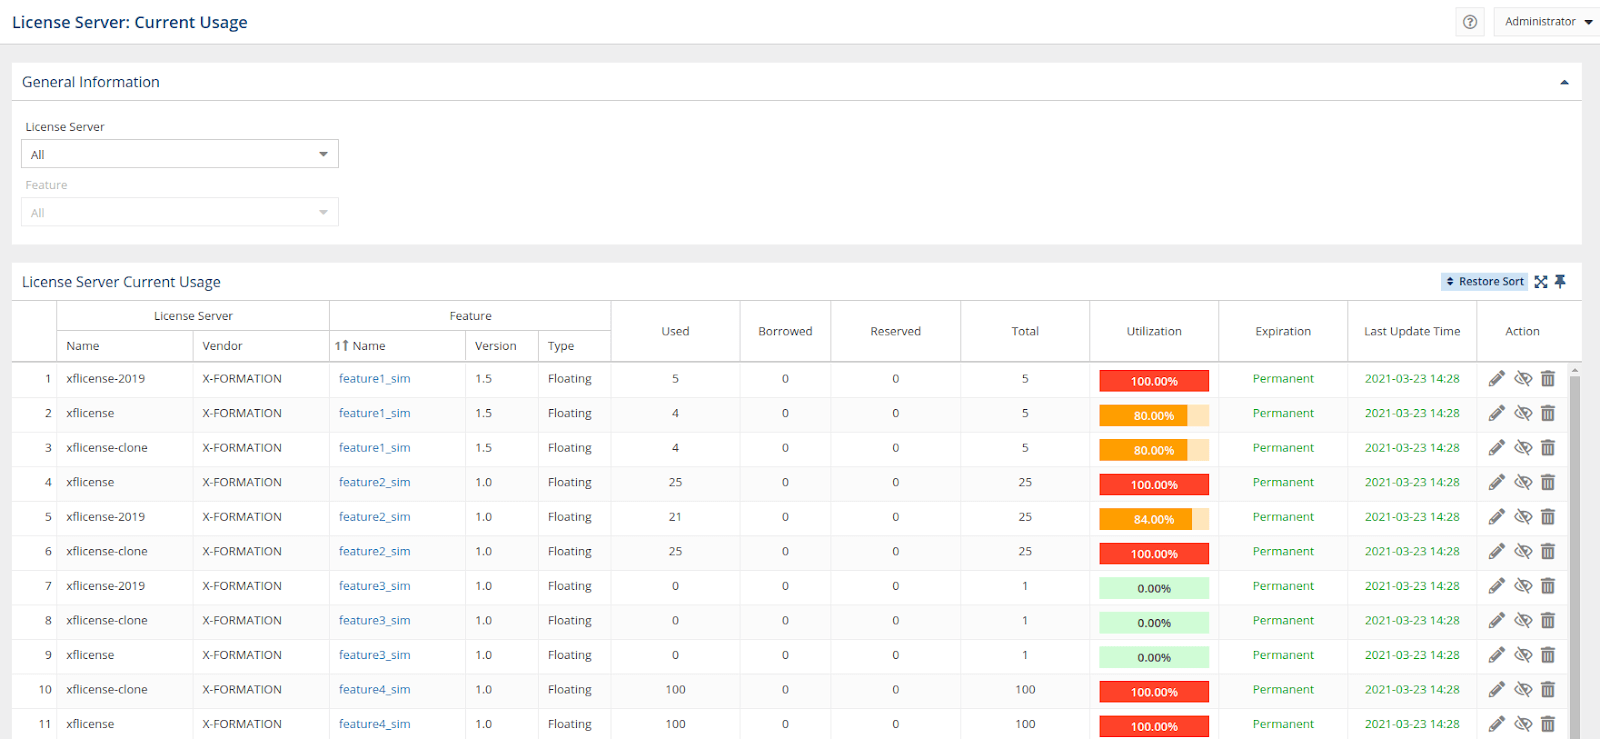
The ability to select all license servers and features on the License Servers – Current Usage report.
The License Server and Feature pick lists at the top of the License Servers – Current Usage report now include an “All” option. To see all features for a selected license server, select “All” from the Feature pick list. When you select “All” from the License Server pick list, the Feature selection defaults to “All” as well.
Improved UI responsive design.
The X-Formation team is devoted to simplifying your license administration tasks through detailed reporting and complete automation of routine tasks – including recapture of idle licenses that would otherwise cost you hundreds of lost productivity hours every month.
As always, please contact support@x-formation.com with your questions. We’ll be delighted to serve you.
Through better planning made possible by using License Statistics to gather more accurate usage data, Skoda achieved a 373.79% ROI and significantly cut license costs.
Client: SKODA ICT S.R.O. Problem: High Costs of CAD/CAM/CAE Software Solution: License Statistics
Problem
Skoda ICT s.r.o. provides ICT services for SKODA HOLDING a.s., which manufactures and repairs commercial vehicles (electric locomotives, subway, railway wagons, tramways, trolley buses) and manufactures steam turbines and related parts.
A global business slow-down led Skoda to focus on prudent use of resources. Stanislav Cechura, IT Engineer, said, “During the current economic downtime, all companies are increasing their focus on minimizing costs and on effective use of expensive licenses.”
Skoda knew it could better manage use of costly CAD/CAM/CAE software licenses if it had a more effective way to monitor and evaluate license usage. The license management tools supplied with the CAD/CAM/CAE products it used did not provide the detailed information needed to make solid decisions about how many licenses they actually needed. Though they added custom scripts to import simple reports on license usage, those reports were not enough.
How SKODA Approached It
Skoda chose License Statistics because the software met, at an affordable price, most of their requirements for monitoring license usage on their individual software applications. Cechura explained, “License Statistics helps us to stay on top of our license requirements. This is vital for planning extension or reduction of the number of licenses we’ll need in the future, helping us save license costs. The detailed monitoring of used licenses allows us to better divide the software costs for the individual companies of the Skoda holding and to find possible reserves.”
What It’s Like Now
Through better planning made possible by using License Statistics, Skoda was able to cut their license fees and achieve an ROI of 373.79% with a 500-user License Statistics license.
X-Formation’s expert support team helped Skoda overcome initial problems with LUM server monitoring, and now, after using License Statistics for over a year, they are trouble-free and satisfied with the product and the level of support.
March 31, 2021|Gabrijel Zelic|in category License StatisticsComments Off on Support for Autodesk Feature Collections Debuts in License Statistics v6.11
Autodesk Feature Collections support, Zoo License Manager support, and a redesigned license server administration interface lead the pack of new features and enhancements delivered by License Statistics v6.11.
The License Statistics v6.11 release brings with it new features and enhancements that further streamline license server monitoring and administration tasks. The new features include:
Support for Autodesk feature collections.
Support for Zoo License Manager.
A redesigned license server administration interface, including:
Support for multiple data sources for a single license server.
New Single License Server grid allowing you to manage all servers independently from data sources.
New add/edit license server form.
Added ability to import usage data from LM-X log files and FlexNet debug log files.
Redesigned data importing, including:
Ability to import data using API endpoints.
A simplified two-step wizard to configure import settings for each file.
Four strategies for merging imported data.
The host IP address is now included on applicable reports.
Discover what the new features will do for you below.
The License Statistics v6.11 introduces Feature Collections support for the Autodesk License Manager.
Collections allow you to separate specific Feature usage reporting based on which package the Feature belongs to, rather than combining all usage of that Feature in a single report. You get more granular information about how your licenses are being used – and whether you’re getting the value for them you expected.
By default, Features do not belong to a Collection until you add them in the Gathering section as you create a license server. Once you have enabled Collections for a license server, features for that license server will be reported based on their Collection name.
You asked, and so in License Statistics v6.11 we added support for the Zoo license manager used with the popular Rhino 3D modeling software.
Remote and Import data sources are allowed for generating reports, and log files can also be imported. License Statistics v6.11 supports feature versioning and license borrowing for imported data.
As we learn of new and popularly used license managers, trust us to give you the support you need for them. See the License Statistics documentation for currently supported license managers.
Redesigned License Server Administration Interface
The License Statistics v6.11 release brings a License Server Administration interface redesigned to streamline administrative functions. Included in the redesign: You can now specify multiple data sources for a single license server. A simplified single License Server grid now allows you to manage all servers independently from their data sources.
A new add/edit license server form is also included in the release. On the reporting side, the host IP address for each user consuming a license is now identified in applicable reports.
New Data Import Features
Not only can you now import usage data from LM-X log files and FlexNet debug log files, but the entire data importing interface has been redesigned both for usability and added functionality.
You can now, for example, import data using API endpoints, giving you more flexibility in the way you bring data into your organization’s dashboards and custom reports. A simplified two-step wizard now guides you through importing settings for each file. There are also four new strategies for merging imported data to give you more flexibility.
The X-Formation team is devoted to simplifying your license administration tasks through detailed reporting and complete automation of routine tasks – including recapture of idle licenses that would otherwise cost you hundreds of lost productivity hours every month.
As always, please contact support@x-formation.com with your questions. We’ll be delighted to serve you.
February 17, 2021|Dawid Tadel|in category License StatisticsComments Off on Generating Custom Reports from License Statistics with Microsoft Power BI
License Statistics customers can use Microsoft Power BI to build customized reports or combine the data it provides with data from other tools to build a unified dashboard.
Microsoft Power BI is a business analytics platform that provides interactive data visualizations for business intelligence (BI). Many X-Formation customers use it to build custom business dashboards to gain insight into key metrics throughout their organizations. The License Statistics API gives you complete access to all the data it tracks, allowing you to integrate it with your own reports and tools.
This article provides an example of how to use data from the License Statistics API to create a custom report.
Scenario
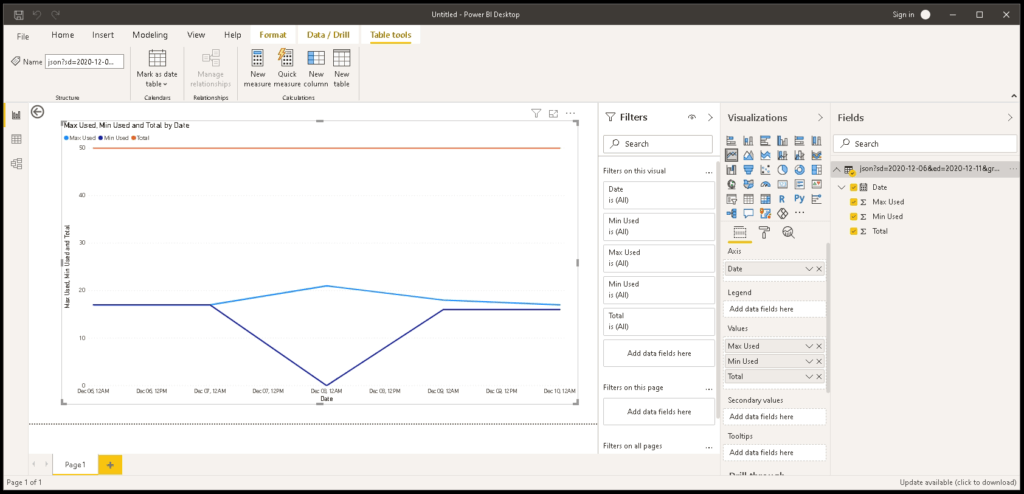
We want to create a Usage History report for a particular feature presenting minimum, maximum usage, and total number of licenses used daily during a selected period of time.
Requirements
A running License Statistics instance
The Microsoft Power BI Desktop application installed
Steps
Accessing the License Statistics API
Adding a Web data source to Power BI
Preparing data
Creating a report
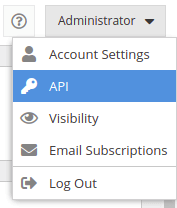
Accessing the License Statistics API
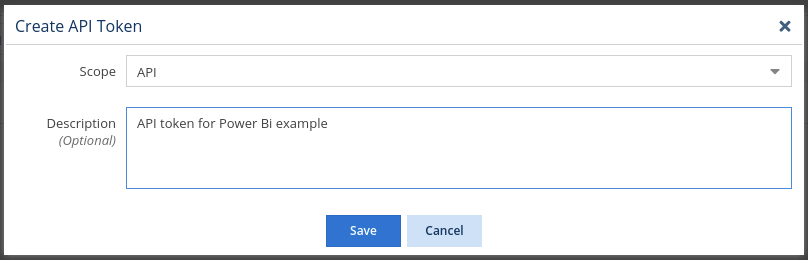
To begin, you must create a token with API scope. Create one by accessing the License Statistics API section in the personal context menu:
Use the Add button to create a new token with API scope.
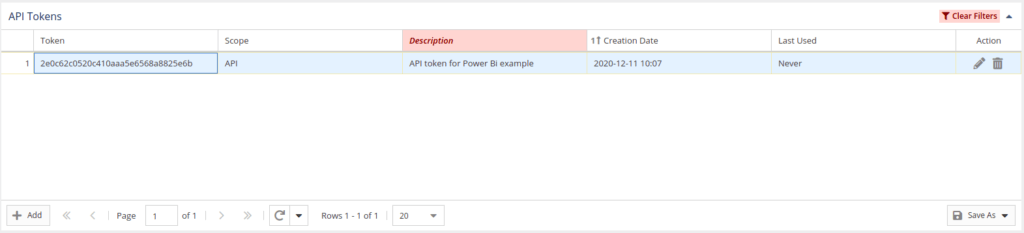
Save the new API token. It now appears in the API Tokens grid.
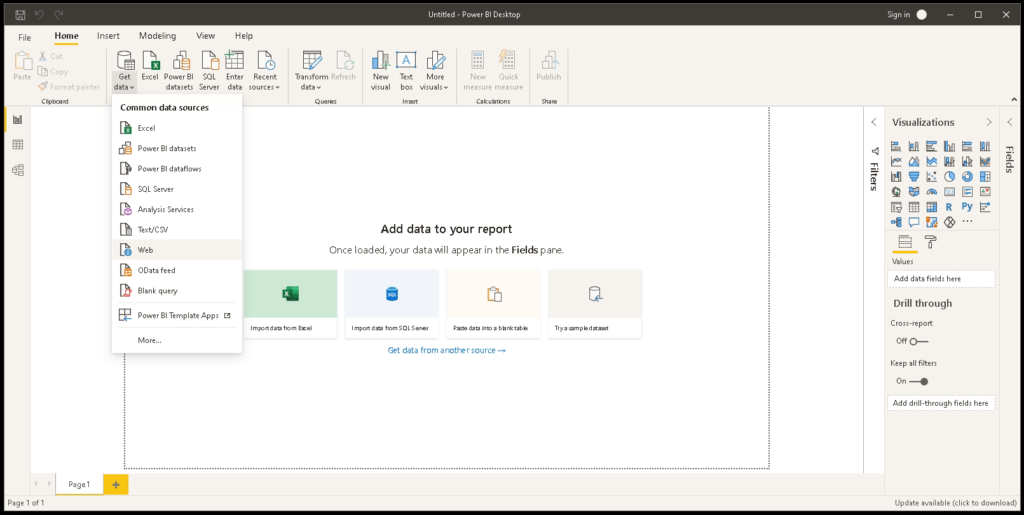
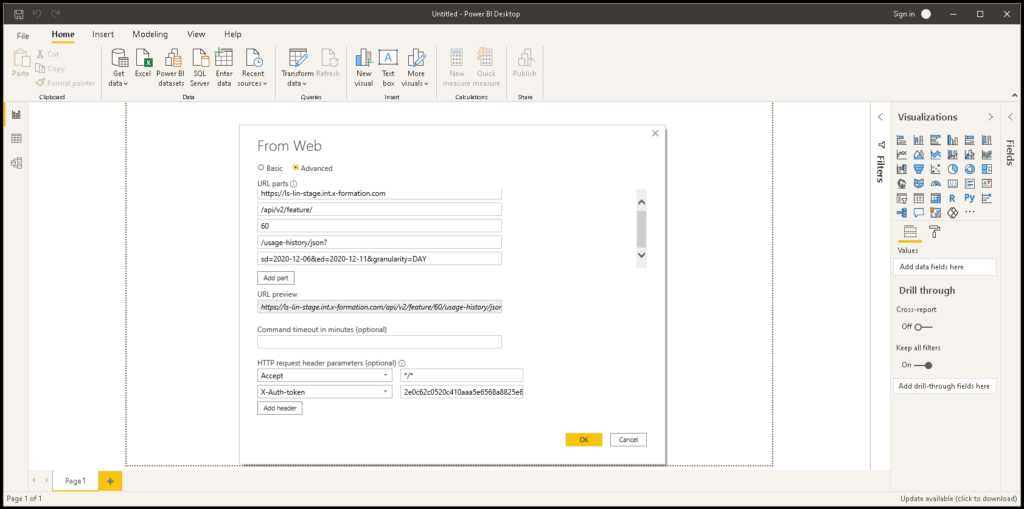
In the Power BI Desktop, create a new report and add a Web data source from the Get Data menu.
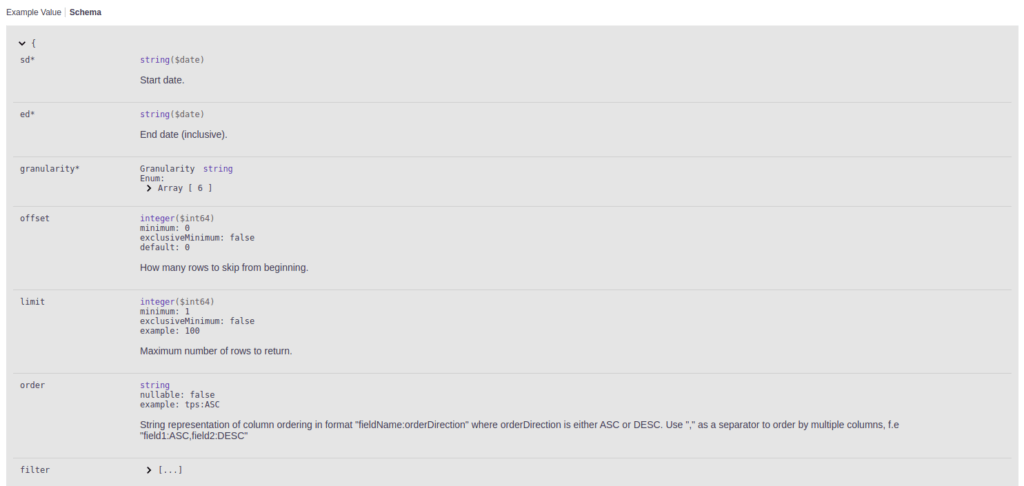
Complete the form presented to you. Use the Advanced option to add API endpoints. For our example we’ll use the /api/v2/feature/{id}/usage-history/json endpoint. (See a complete list of API endpoints in the interactive API documentation.)
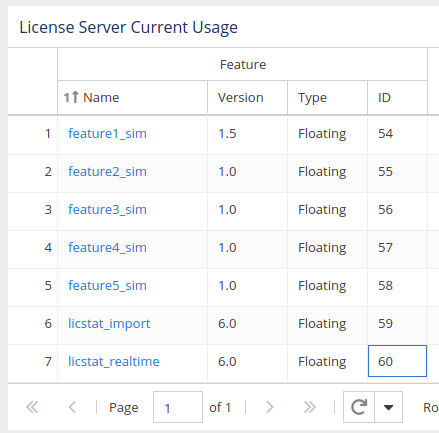
The Feature ID (set to 60 in our example) can be taken using the /api/v2/feature/list endpoint, but also can be taken from the License Statistics UI by displaying the Feature ID column (hidden by default) on any grid.
Let’s set the query parameters for a start date of December 6, 2020, and an end date of December 11, 2020:
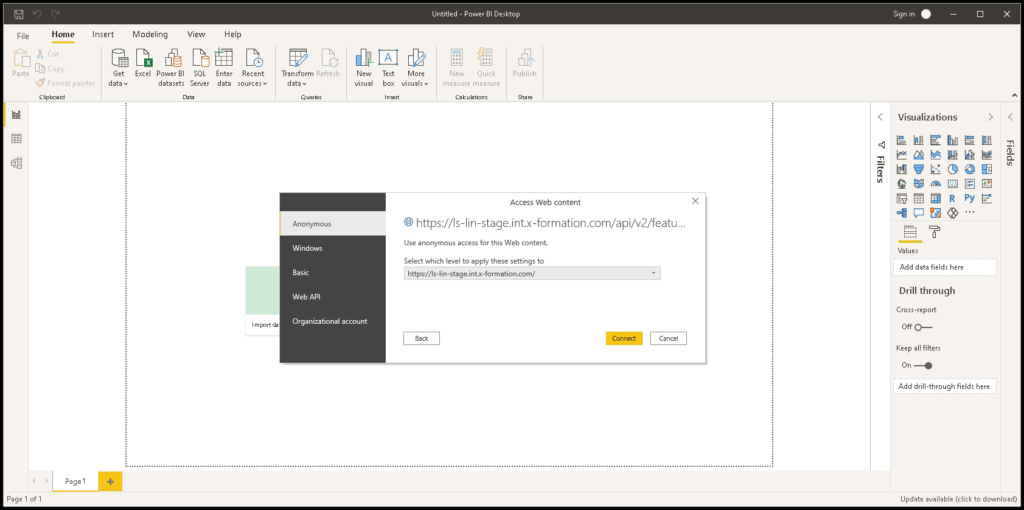
When asked, use the Anonymous access option. Authorization has been already handled by the token added to the header in the previous step.
Use the Connect button to access the defined Web source and get requested data.
Preparing data
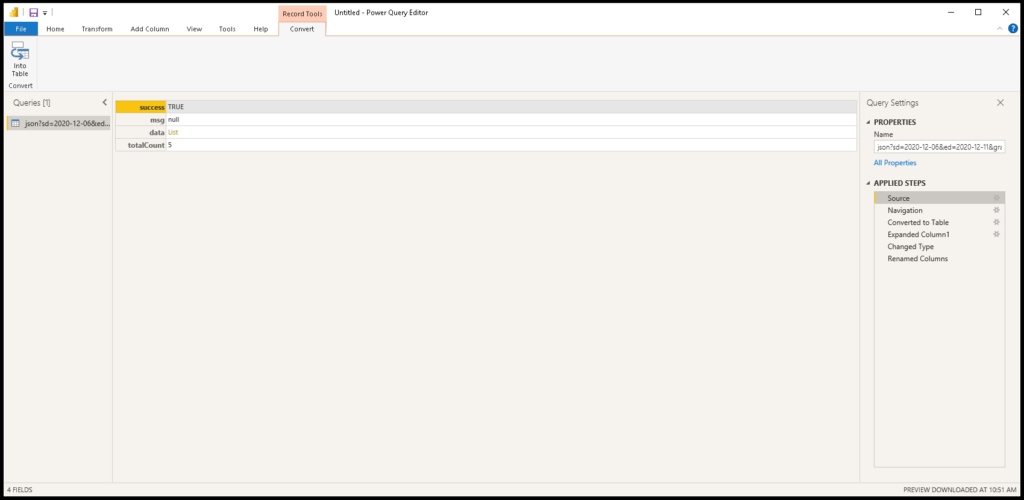
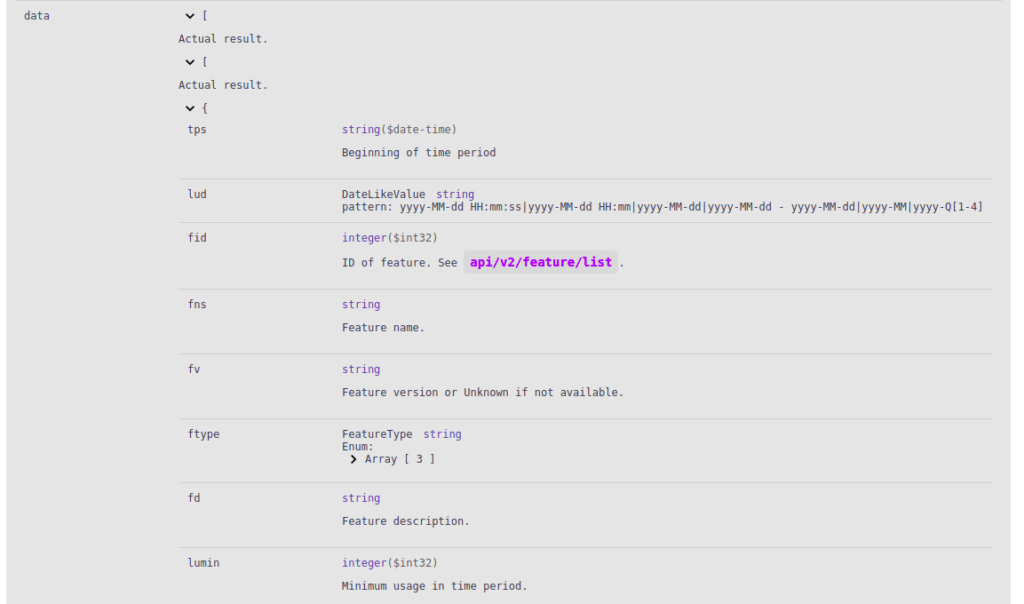
Data received from the License Statistics API must be formatted before you can read it.
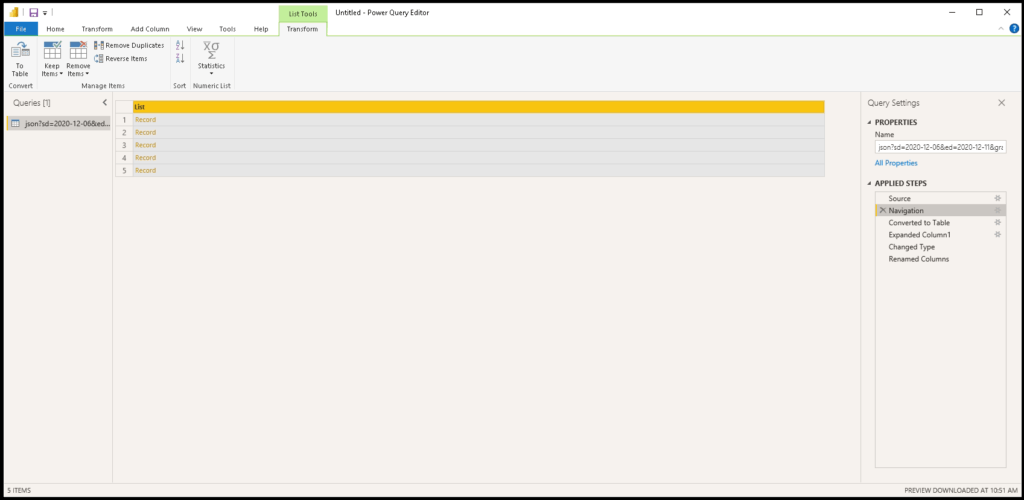
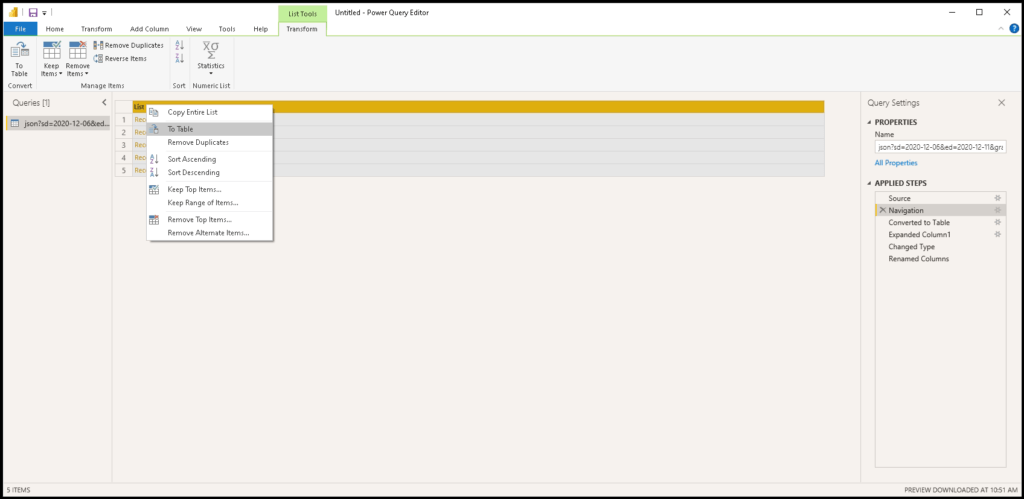
Use the List link to navigate to the data key details.
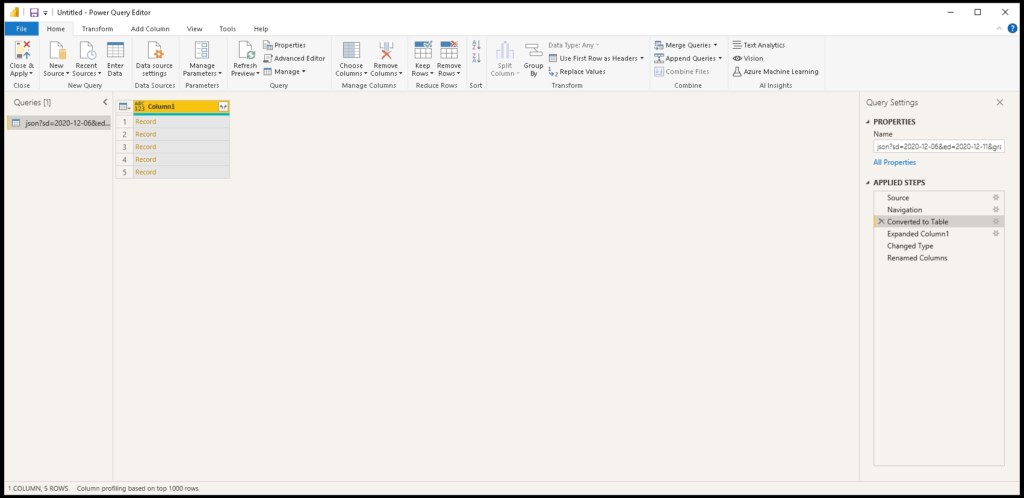
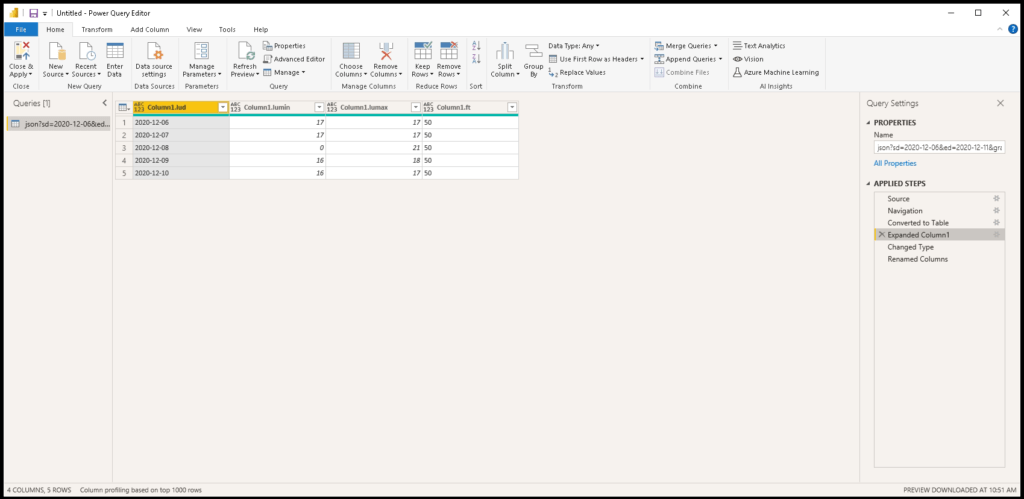
Convert the list of records to a table using the To Table option.
Your results are displayed as shown below.
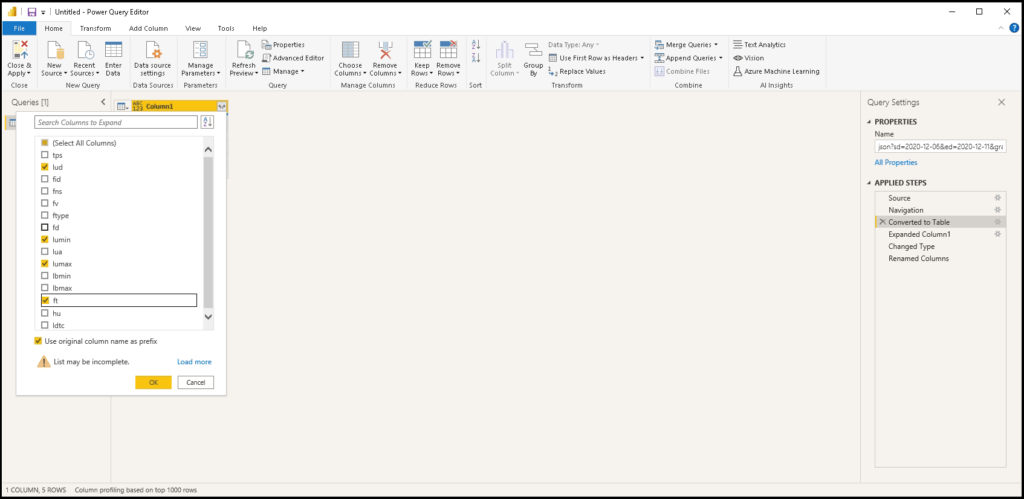
The resulting Table of records can be expanded to include multiple columns. We don’t need all the fields from the response to achieve our goal, so we’ll select only those which are needed in our scenario:
lud (date)
lumin (min used)
lumax (max used)
ft (total)
Note: You can also set a list of returned columns using the fieldsVisibility request parameter.
The table will be expanded to a multi-column view.
Note: A full list of the parameters with description is available in the interactive documentation.
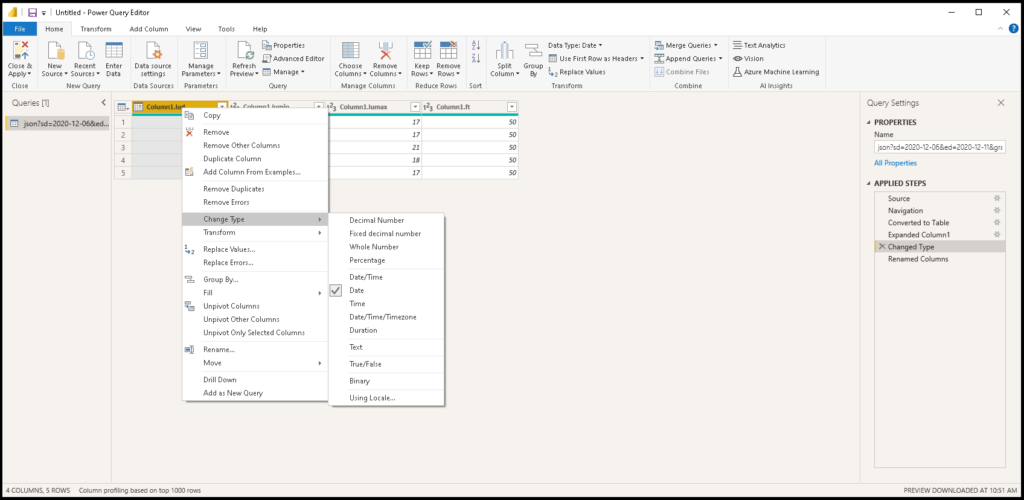
For proper processing we need to define the type of data for each column. In our case, the lud property is a Date type, while the rest of the properties are Whole Numbers.
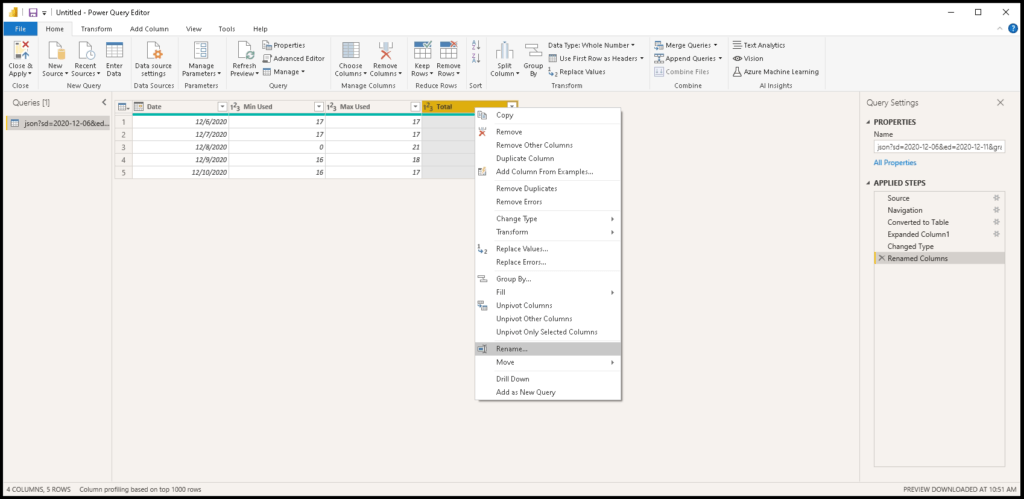
Rename the columns to present them more clearly in reports.
Creating a Report
Once you have prepared the data source, you can use the data to create your custom report. We chose to create a line chart. On the X Axis there is a Date, and on the Y Axis we have values from 3 data series: Max Used, Min Used, and Total.
You can see from this basic example that with powerful visualization tools like Microsoft Power BI and rich data from the License Statistics API you can bring even greater value to your company in the areas of license management and optimization.
As always, the X-Formation team loves to hear your feedback and suggestions for new features. If you have ideas or need help, please contact support@x-formation.com or contact your X-Formation representative.
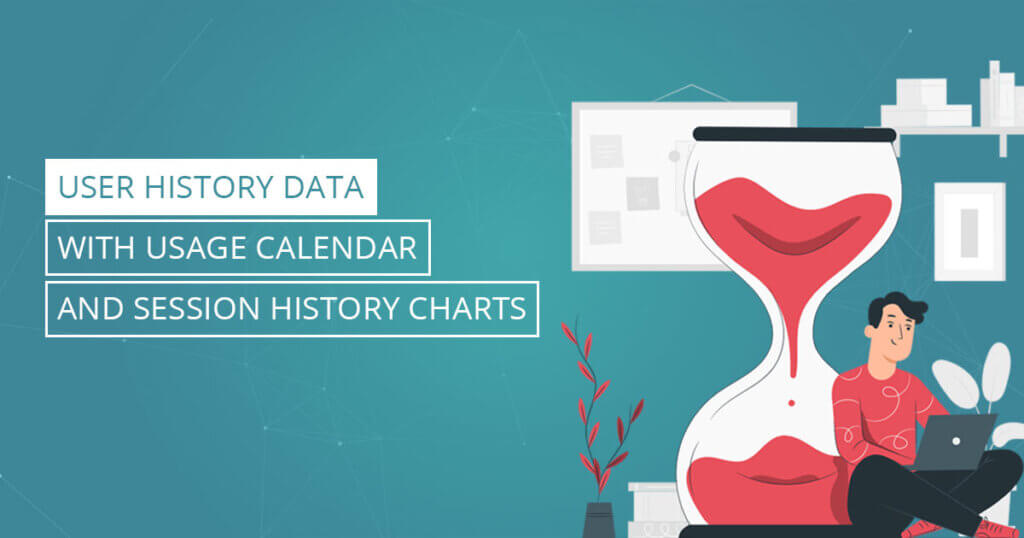
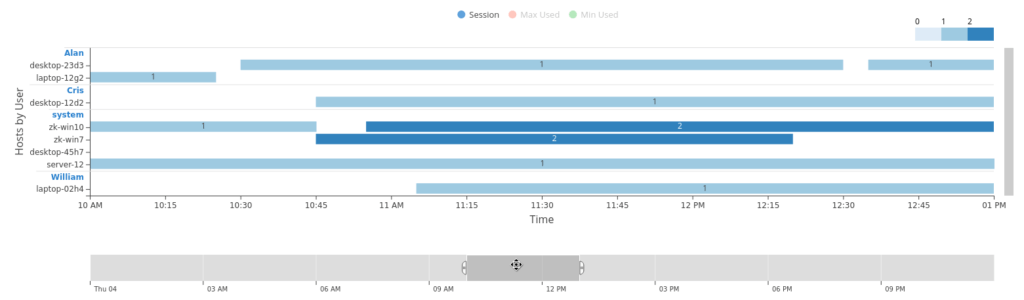
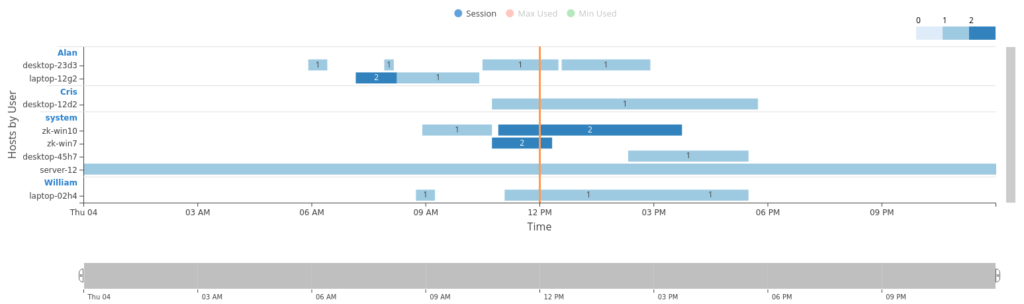
January 28, 2021|Dawid Tadel|in category License StatisticsComments Off on User History Data with Usage Calendar and Session History Charts
Gain deeper insight into User History data than ever before with License Statistics v6.9. The new User History Gantt chart lets you view license use for a selected feature by user session on any day or time you choose.
Starting with v6.9, License Statistics provides even more granular data about User History. You can now see all sessions for users who use licenses for any feature you select, on any date or at any time you choose. The new User History Gantt chart, part of the Usage Calendar, presents the data you want in a simple, easy-to-read format.
The Usage Calendar and Session History Charts
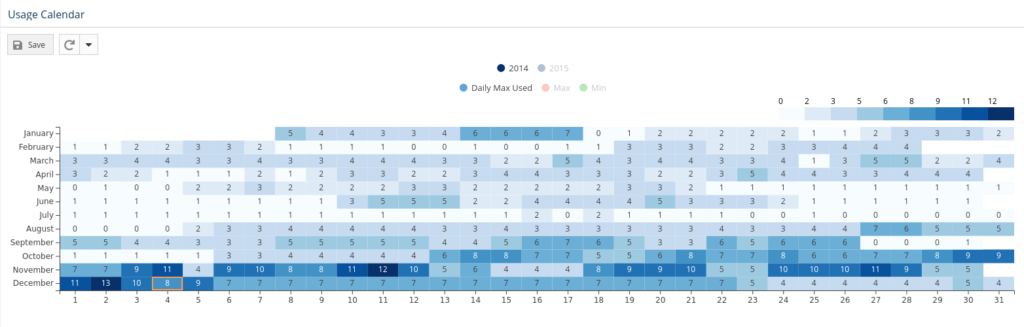
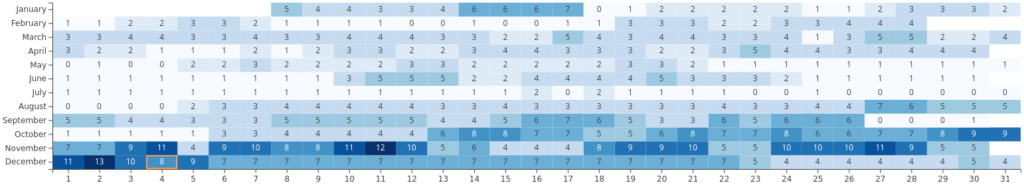
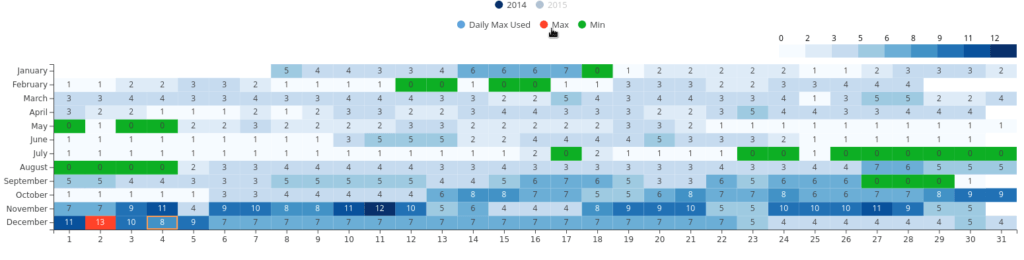
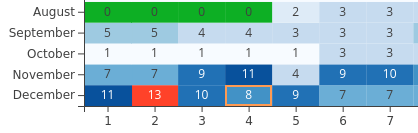
The Usage Calendar shows daily maximum usage of a selected feature for a chosen date range you choose in page settings. The chart is a heatmap with the month on the vertical axis, and the day of the month on the horizontal axis.
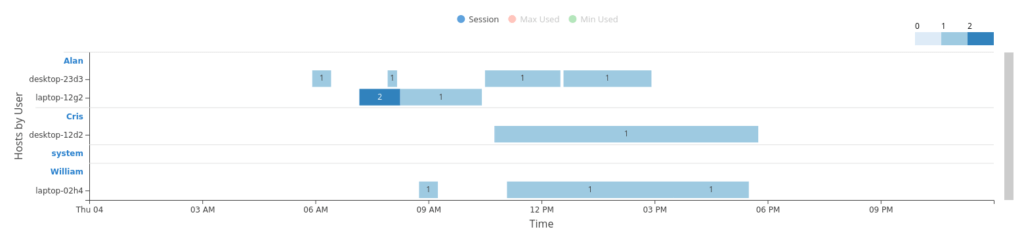
The Session History chart displays a Gantt chart showing user sessions for concurrent hosts.
Viewing the Usage Calendar
You can view data for any date or range of dates with the Usage Calendar.
You can even view the entire year at once, and easily switch between years using the buttons in the legend above the chart.
The Usage Calendar shows both minimum and maximum usage for the date range you selected in settings, and for the year selected on the chart’s legend.
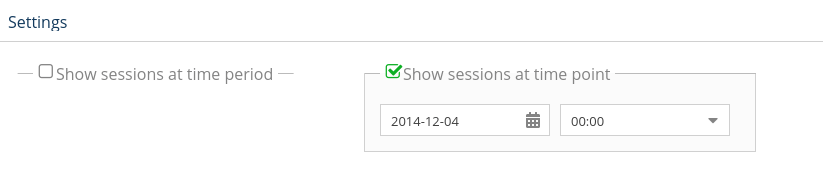
Click any day to view its Session History chart, where you will find detailed data about usage on that day. The day you select is marked with an orange border.
Note: When you are viewing the session at a selected time point, the Chart is hidden.
How to View the Session History Chart
Go to Features → User History page.
On the Usage Calendar, click the day you are interested in. (If you are on the Settings page, you can use the “Show sessions at time point” section to go directly to any day you choose.)
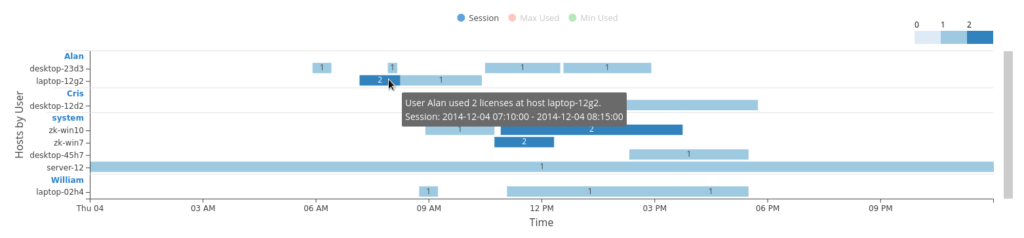
Your Session History chart for the chosen day will then display a Gantt chart with user sessions for concurrent hosts.
How to Use the Session History chart:
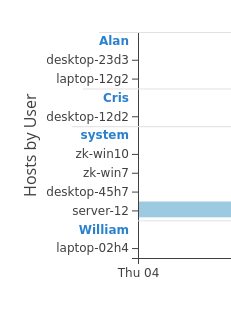
The Y axis of the Session History chart groups all hosts by user.
Click the user name (highlighted in blue) to expand or close the hosts view for that user:
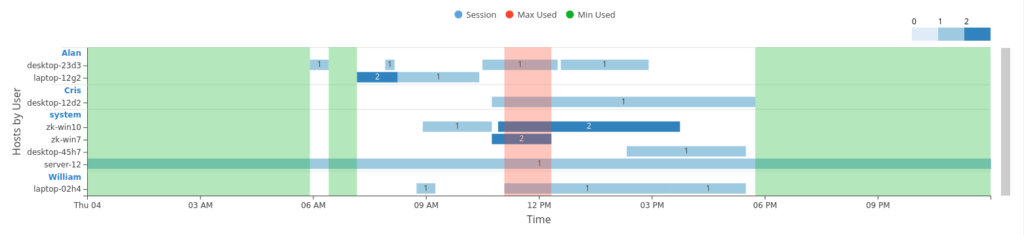
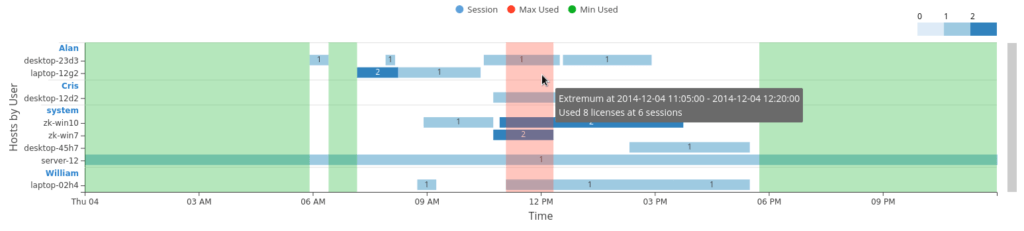
Click Max Used or Min Used to highlight extremas in user data:
Hover the pointer over an extremum, and a tooltip appears providing more information about the extremum:
Use the time range brush below the chart to set the range of time you wish to view, or use it to create a PNG report file for a smaller range of time:
Select a specific point in time to view sessions at that time point:
As you’ve seen, License Statistics makes it easier than ever to gather the User History data you need to make better decisions. The data you want is presented in a way that gives you greater insight into license usage throughout the organisation. Try the new features and see for yourself.
As always, the X-Formation team loves to hear your feedback and suggestions for new features. If you have ideas or need help, please contact support@x-formation.com or contact your X-Formation representative.