Dashboards are an important tool for readily visualizing and monitoring key performance indicators. While previous releases of License Statistics offered a single dashboard on which to pin reports, our newest major release, v7.0, lets each individual License Statistics user define and separately manage an unlimited collection of customizable, shareable dashboards. With multiple dashboards, you can much more readily access the specific information you’re interested in, so you can quickly spot trends in usage and make better-informed decisions about your license management.
Simple creation
License Statistics dashboards are easy to create using pre-defined templates – including Realtime and Historical report dashboards – or by copying any existing dashboard. If you are upgrading from an older version of License Statistics, your existing dashboard will be automatically migrated when you install License Statistics v7.0, so you won’t lose that dashboard you’ve grown accustomed to. Your old dashboard is included as “Old Dashboard” in your Dashboards menu.
You can copy an existing public or private dashboard with the click of a button. The new dashboard is automatically added to your dashboards collection. All copied dashboards are created as a private copy of the original dashboard, owned by the user who copied it. You can customize your copied dashboards in the same way as any other dashboards you own.
Manageability
We’ve made dashboard management straightforward with the introduction of the Manage Dashboards page, accessible from any dashboard. The Manage Dashboards page gives you one place to add, remove, share, and organize your dashboards.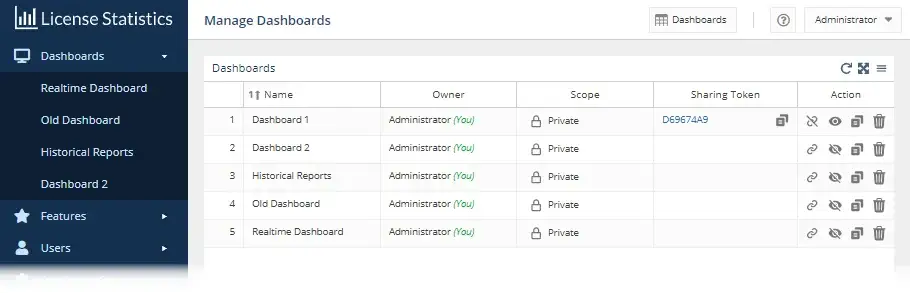
A menu to choose from
Dashboards are not automatically added to the Dashboards menu; they are only listed in the Manage Dashboard page’s Dashboards grid. For instance, a dashboard you’ve copied will appear in your Dashboards grid but won’t automatically show up in the Dashboards menu. Similarly, if a user makes a dashboard public, other users will see it on their Manage Dashboards page but won’t see it in their Dashboards menu by default.
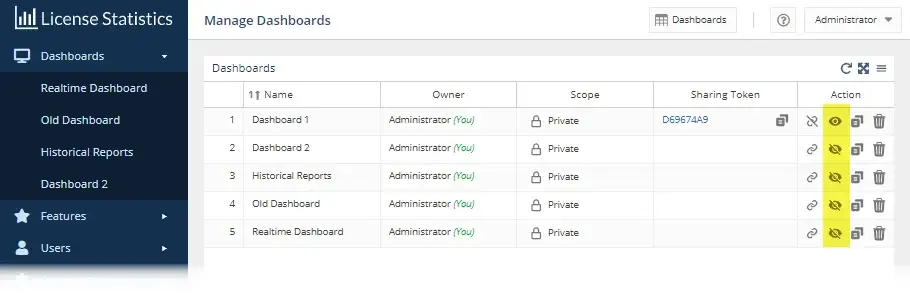
You can toggle menu visibility on and off with a single click using the hide/show icon in the new Manage Dashboard page’s Action column.
You can also easily click and drag dashboard items shown in the Dashboards menu to reorder them, so the dashboards you use most often are shown at the top of your Dashboards menu.
Ability to control private/public access
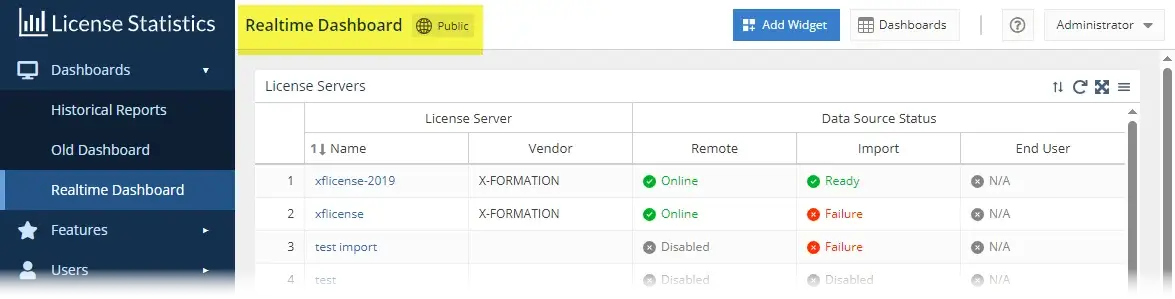
By default, your dashboards are private, viewable only by you. Any dashboard can be made public by the user who owns it, making it viewable by all other License Statistics users. When you open a dashboard, you can quickly see whether it’s public or private by looking at the top of the page, as shown in the illustration below for a public dashboard.
You can readily switch a dashboard you own from private to public, as well as see who the owners of other publicly shared dashboards are, using the Scope column of the Dashboards grid in the Manage Dashboards page.
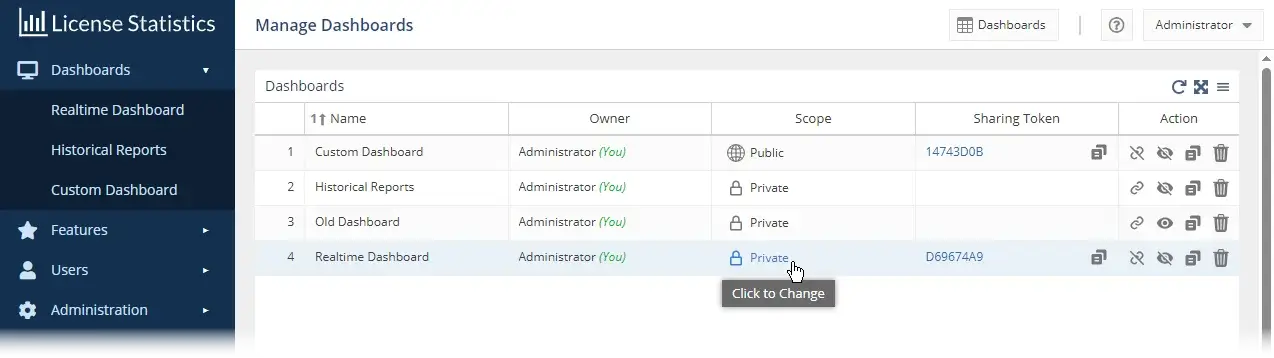
In addition, you can automatically create shareable links, shown under the Sharing Token column, giving you the flexibility of sharing dashboards with others who are not License Statistics users. You can also use links to display a dashboard of general interest on company monitors in your office’s open spaces or embed a dashboard on internal company websites.
Whether you make your dashboard public or share a link, the dashboard is made available as a read-only version.
Easily add to and customize your dashboards
There’s flexibility in how you add to your dashboards. Any report grid or chart that has a Pin to Dashboard icon (shown at the upper right of the grid or chart) can be added to a dashboard.
In addition, you can select pinnable elements to add to dashboards from a complete list of available widgets. Widgets are fully customizable; you choose the settings and details you want to include. Depending on the widget type, you can select specific settings for the widget, as for the Usage per User widget shown in the illustration below.
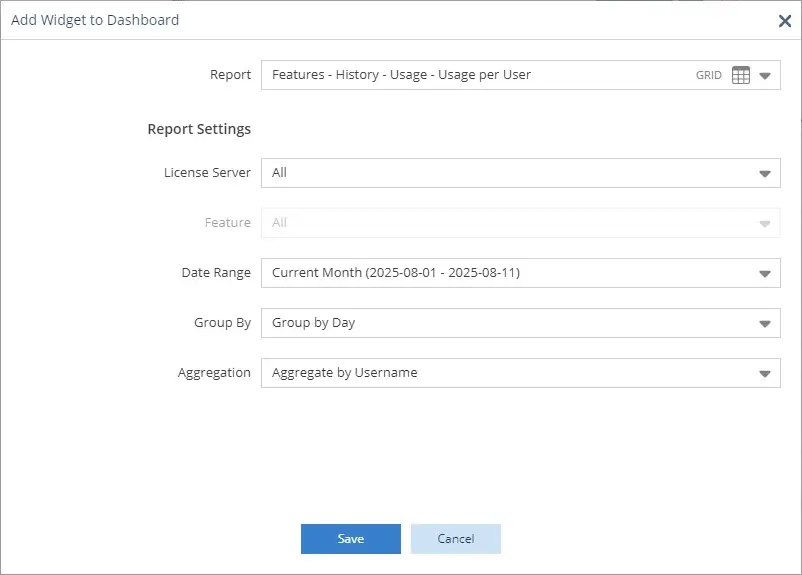
You can drag and drop the report widgets to create the layout you like, as well as control each widget’s appearance, such as name, color, and size.
Dash to boosted productivity
We trust that you’ll find our fully redesigned dashboard capabilities helpful in more readily visualizing your software license usage in ways that are most meaningful and beneficial to your entire organization.
This significant enhancement is available only with License Statistics v7.0 or newer, so if you’re an existing customer and haven’t yet upgraded to v7.x, don’t delay. Contact X-Formation Sales today to make your move to License Statistics v7.x, and take advantage of a special offer!