Customizable branding tools, interactive API documentation lead the list of features and enhancements for License Statistics v6.3 and v6.4.
The v6.3 and v6.4 releases of License Statistics bring both new features and customer-requested enhancements to further simplify your software license asset management tasks. Highlights of the new release include a new User Usage History report, customizable UI elements for branding, and interactive API documentation.
What’s New?
License Statistics v6.3 and v6.4 bring the following new features:
- A new User Usage History report that allows you to get usage history for a selected user or group.
- The ability to customize UI elements for branding purposes.
- Interactive API documentation embedded in the user interface using Swagger (https://swagger.io)
- Ability to group by year on the Usage Per User report.
- The ability to delete old, unneeded data from the License Statistics database.
Most of these improvements come thanks to your feedback – your success is our success. The new features added in the v6.3 and v6.4 releases are highlighted below. (Refer to the License Statistics v6.3 and v6.4 Release Notes for a complete list of enhancements to existing features.)
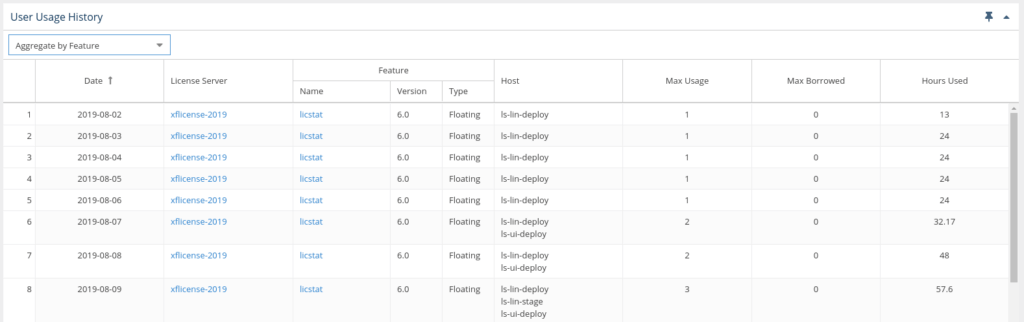
New User Usage History Report
We’ve been busy enhancing the User Usage History Report over the past few releases, starting with v6.2 in which we introduced the ability to view license usage history by Current Usage and Denials. With the v6.3 release, the User Usage History report now gives you the ability to view license usage history by a selected user or group (available only with the new licensing model). The report makes it easy to select the user/user group for which you want to view usage history and specify time intervals to include in the results.
To view the report, select the Usage History page under the Users section in the left navigation pane. Remember, you can also add the Usage History grid and graph to the License Statistics Dashboard for fast and easy tracking.
Customizable Branding of UI Elements
One of the big features you’ve asked for is the ability to apply your organization’s branding to the LIcense Statistics interface. With the new release you can now add your company logo to certain UI elements, display a custom favicon, and make other changes to reflect your corporate identity. Use the Branding section in the Miscellaneous page, located under the Administration section of the left navigation pane. (You must be an Administrator to make these changes.)
You can customize:
- The application name displayed in the browser title, footer, exported reports, and email templates.
- The logo image displayed on the login page, above the navigation pane, in email notifications, and in exported reports.
- The favicon image.
- Visibility of the footer containing the X-Formation logo and versions, displayed in the UI and in email notifications.
For details on customizing License Statistics and the requirements for logo images and favicons, refer to the License Statistics documentation.
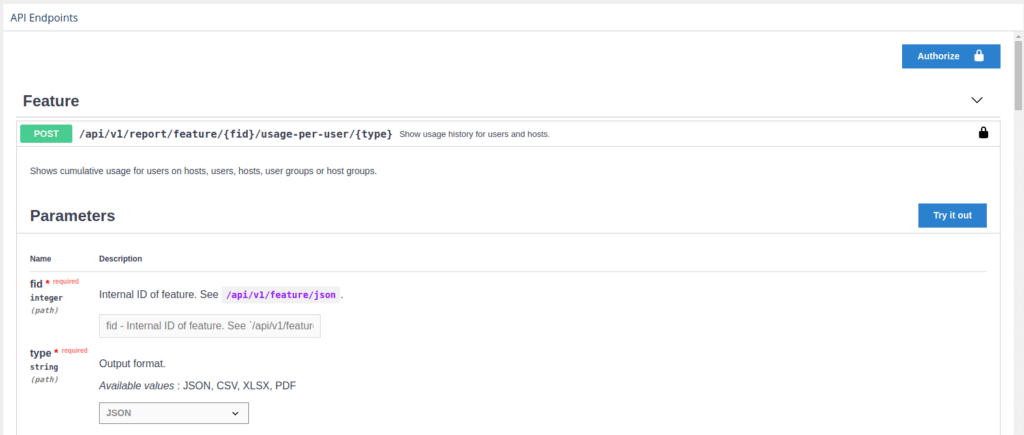
Interactive API Documentation
For your quick and easy reference, you can now get interactive API documentation directly on the API page using the embedded Swagger application. The interactive documentation is always up-to-date, so you can set up API calls knowing you have the latest information.
The new interactive documentation makes API development even easier thanks to the following features:
- Test and run examples directly from the License Statistics UI.
- Get immediate access to all return codes and parameters.
- See built-in examples of the types of calls you can make.
- Simplified authorization requests: The API documentation tool automatically authorizes requests with the current user token.
The interactive API documentation contains endpoints related to all reports, as well as charts including user, license server, and features scope.
Group by Year on the Usage Per User Report
The Usage Per User Report now gives you the ability to group reports by year. When you limit license usage information to a year, you’ll see usage within the selected year based on daily usage. Doing so gives you a bigger picture of high usage trends, helping you spot infrequent but important spikes in usage.
Delete Old Data from the License Statistics Database
Administrators are now able to remove data older than the previous calendar year from the License Statistics database. To do so, select the Database Management tab from the Administration page.
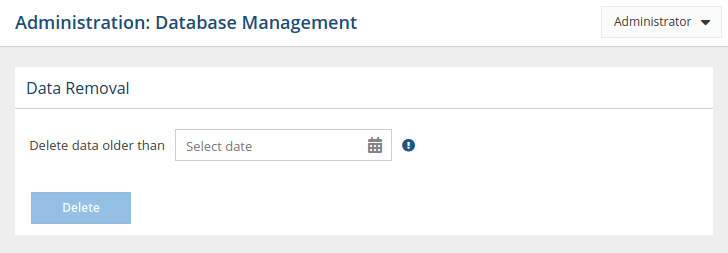
If, for example, the current date is February 5, 2020, you will be able to select dates starting January 1, 2019 and older only. (You cannot remove data from the current or previous calendar year.)
Things to remember:
- Once you confirm deletion, License Statistics will schedule the deletion to occur when you restart it. (You can always cancel any time prior to restarting.)
- Plan deletion carefully. The process can take hours to complete, depending upon the amount of data you select. No data is collected during the deletion process, so be sure to schedule the deletion during non-critical hours if possible.
Of course, we’ve also enhanced a few things on the back end to improve usability and application behavior. To discover more about the new features and enhancements, consult the Release Notes for License Statistics v6.3, v6.4, and v6.4.1.