Features and Enhancements in License Statistics v6.5
Feature and User Reservations, User Usage History heat map chart, new License Servers Usage page lead the list of features and enhancements for License Statistics v6.5.
The v6.5 release of License Statistics brings both new features and customer-requested enhancements to further simplify your software license asset management tasks. Highlights of the new release include the new Feature and User Reservations pages, easy-to-read heat map charts on the User Usage History page, and the new License Server Usage page.
These features are available only with the new License Statistics licensing model.
Let’s dive in.
Feature Reservations Page
The Feature Reservations page provides an overview of all reservations for a selected license server and feature. You’ll find it under the Features section in the left navigation page. (See the documentation for Feature Reservations for more details.)
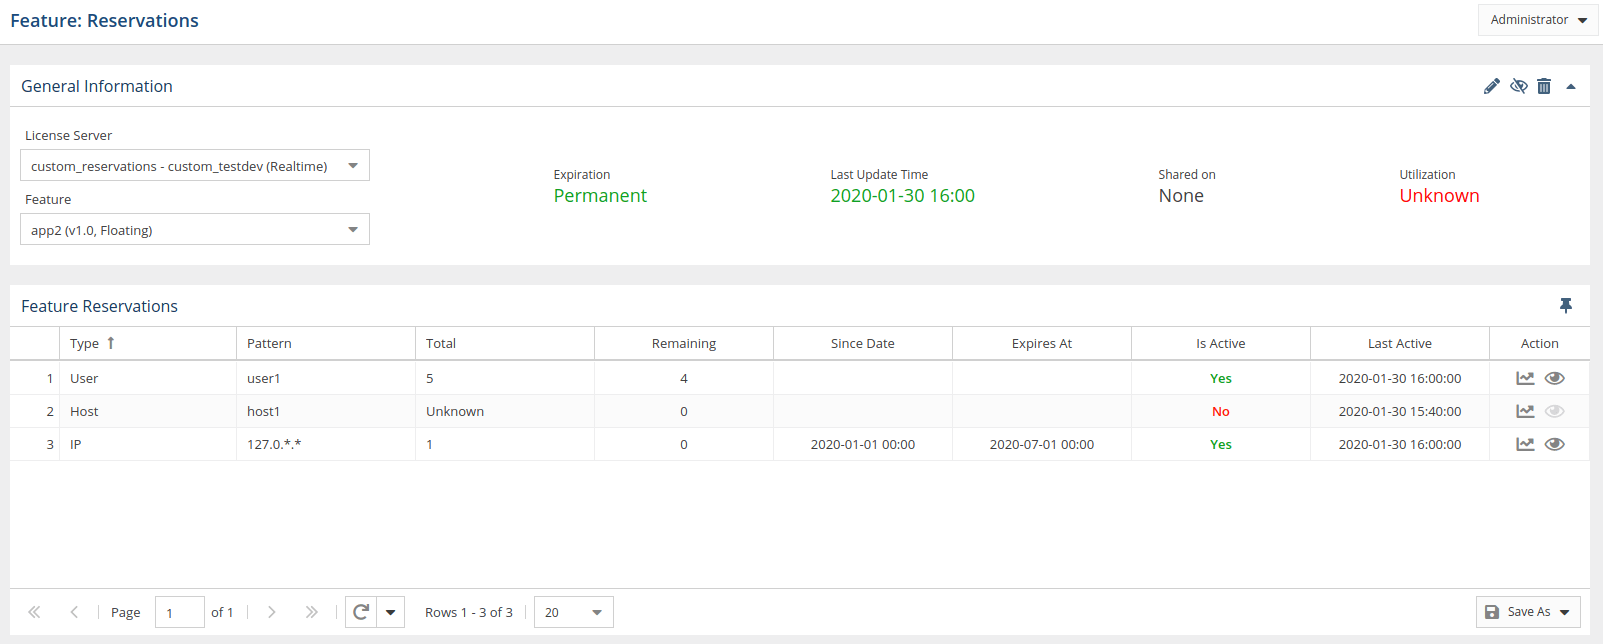
The Feature Reservations page provides a General Information grid and a Feature Reservations grid.
- The General Information grid includes identifying information for the license server and feature. You can set the license server and feature of interest in this grid.
- The Feature Reservations grid shows detailed information for the selected license server and feature.
You can add the Features Reservation grid to the dashboard for quick viewing.
Once you’ve selected a license server and feature, click the chart icon under the Action column to see the associated Reservation History graph. If the reservation is active, you can also get more details in the Reservation Details section by clicking the View icon under the Action column.
User Reservations
The User Reservations page provides an overview of all reservations across all features and license servers for a selected user or group. You’ll find the User Reservations page under the Users section in the left navigation pane. (See the documentation for User Reservations for details.)
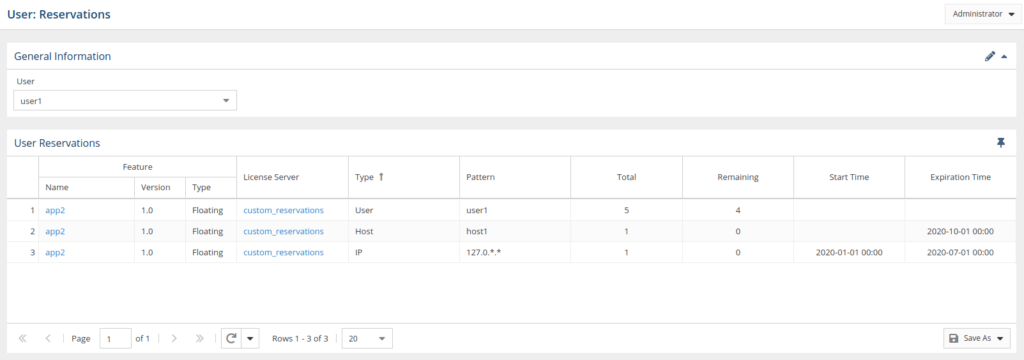
The User Reservations page, like the Features Reservations page, contains a General Information grid and a User Reservations grid:
- The General Information grid lets you select the user or user group to view reservations for.
- The User Reservations grid shows detailed information for a selected user or group, based on the pattern gathered from each queried server.
You can add the User Reservations grid to the dashboard for quick viewing.
User Usage History Heat Map
In License Statistics v6.5 you can now view the Usage History Graph as a heat map. Once you select a desired grouping in the User Usage History Settings area, clicking the “Show Heat Map” button at the top of the graph displays the heat map.
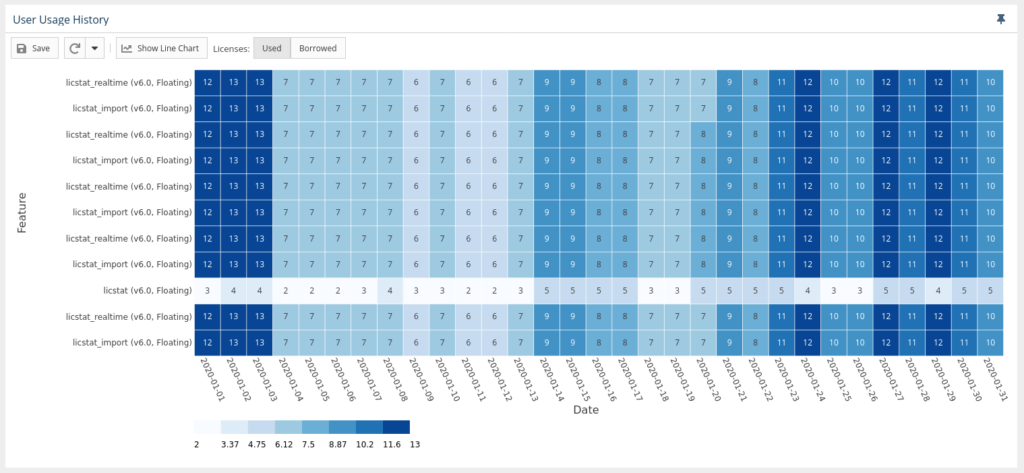
The heat map version of the chart allows you to toggle between used or borrowed licenses. The X axis of the heat map reflects the grouping you selected, and the Y axis reflects all the features used by the user or group in the selected time range. Where the axes overlap is the number of licenses used, and the background coloring corresponds with the scale.
Refer to the documentation for details on the User Usage History page.
License Servers Usage Page
The new License Servers User Page allows administrators to monitor statistics about how each license server is being used. You’ll find the License Servers Usage page under the Administration section in the left navigation pane.
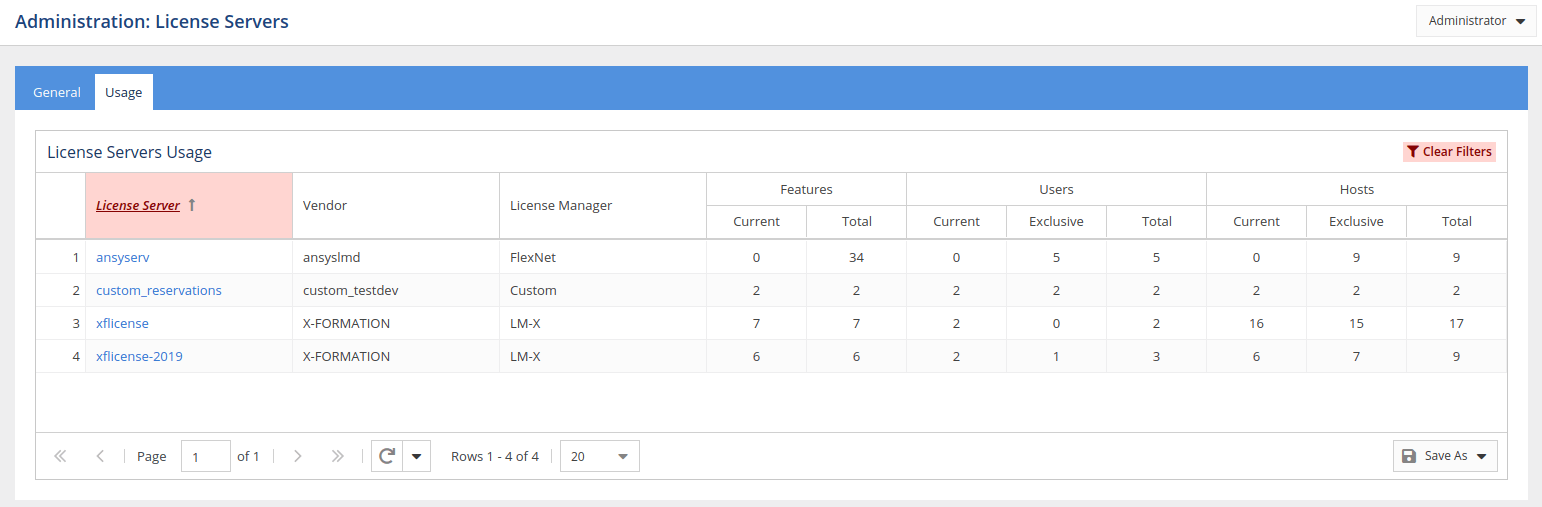
Administrators can use the License Servers Usage grid to get details on the number of features, users, and hosts in the database for each license server. Hover your cursor over any number in the grid to see a list of users/hosts/features included in the reported count.
Of course, we’ve also enhanced a few things to improve usability and application behavior. To discover more about the new features and enhancements, consult the Release Notes for License Statistics v6.5.
Get to know License Statistics