
License Statistics customers can use Microsoft Power BI to build customized reports or combine the data it provides with data from other tools to build a unified dashboard.
Microsoft Power BI is a business analytics platform that provides interactive data visualizations for business intelligence (BI). Many X-Formation customers use it to build custom business dashboards to gain insight into key metrics throughout their organizations. The License Statistics API gives you complete access to all the data it tracks, allowing you to integrate it with your own reports and tools.
This article provides an example of how to use data from the License Statistics API to create a custom report.
Scenario
We want to create a Usage History report for a particular feature presenting minimum, maximum usage, and total number of licenses used daily during a selected period of time.
Requirements
- A running License Statistics instance
- The Microsoft Power BI Desktop application installed
Steps
- Accessing the License Statistics API
- Adding a Web data source to Power BI
- Preparing data
- Creating a report
Accessing the License Statistics API
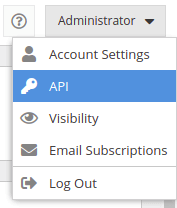
To begin, you must create a token with API scope. Create one by accessing the License Statistics API section in the personal context menu:
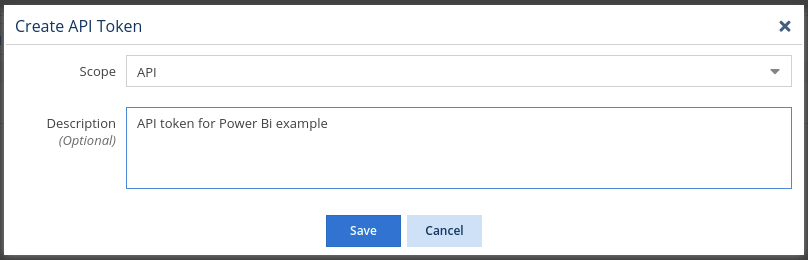
Use the Add button to create a new token with API scope.
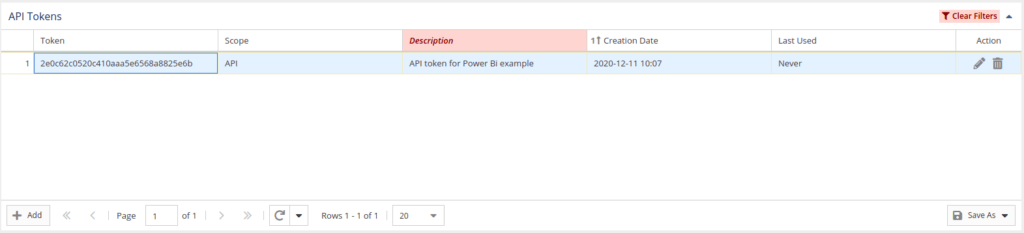
Save the new API token. It now appears in the API Tokens grid.
See the License Statistics documentation for more details about accessing the API.
Adding a Web Data Source to Power BI
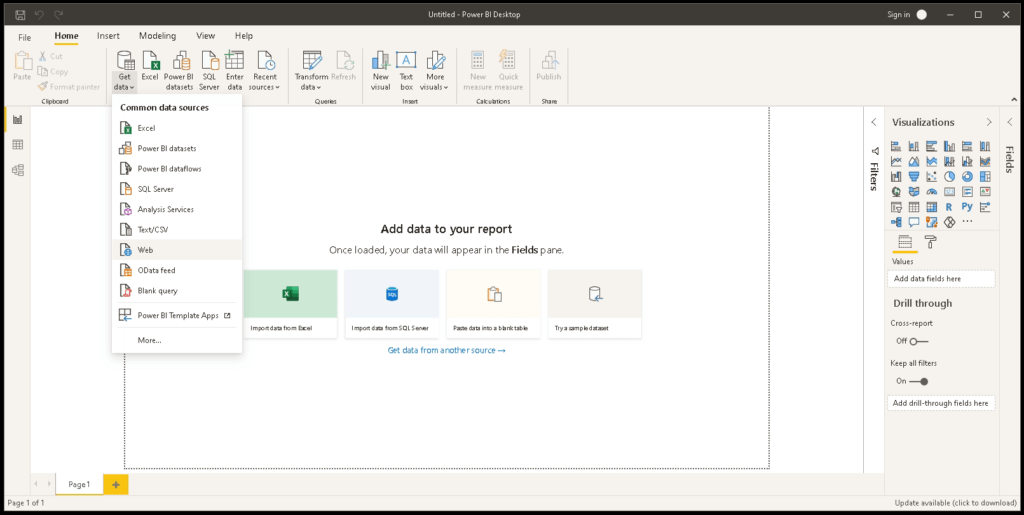
In the Power BI Desktop, create a new report and add a Web data source from the Get Data menu.
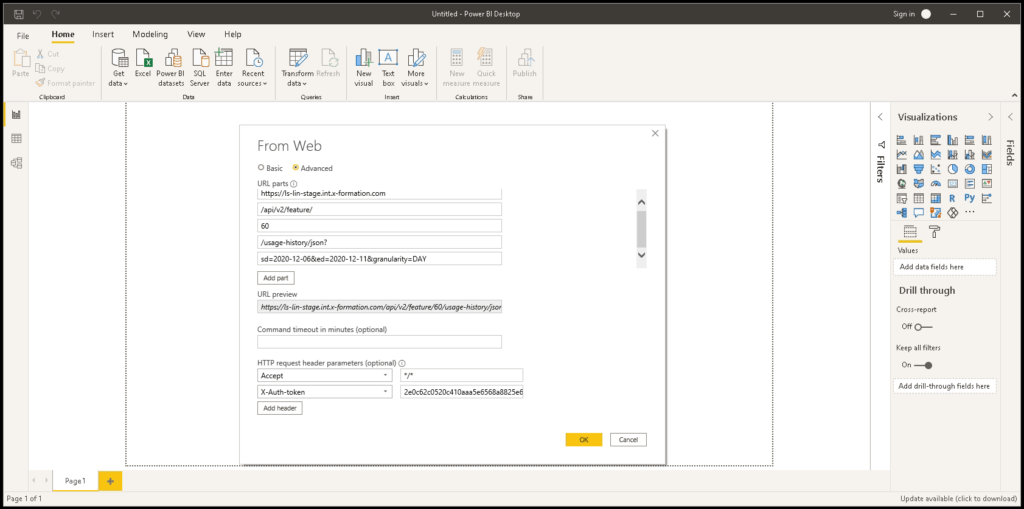
Complete the form presented to you. Use the Advanced option to add API endpoints. For our example we’ll use the /api/v2/feature/{id}/usage-history/json endpoint. (See a complete list of API endpoints in the interactive API documentation.)
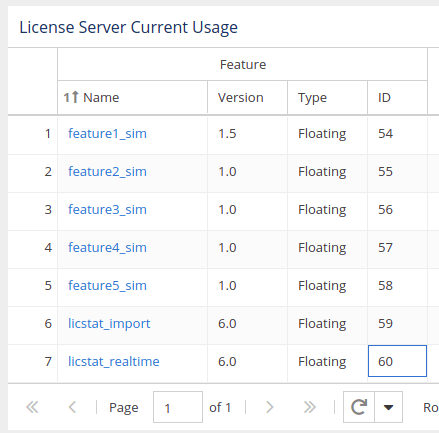
The Feature ID (set to 60 in our example) can be taken using the /api/v2/feature/list endpoint, but also can be taken from the License Statistics UI by displaying the Feature ID column (hidden by default) on any grid.
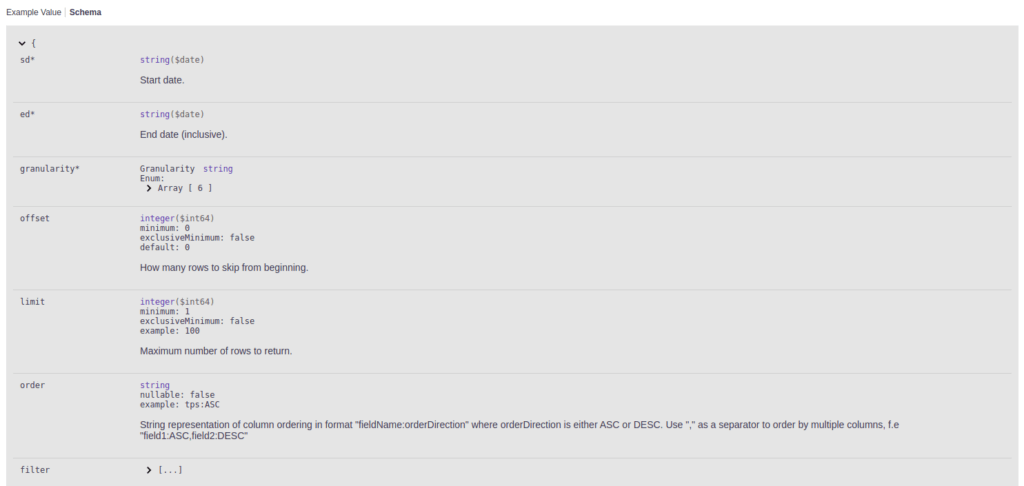
Let’s set the query parameters for a start date of December 6, 2020, and an end date of December 11, 2020:
- sd=2020-12-06
- ed=2020-12-11
- granularity=DAY
See a complete list of optional API endpoint parameters in the interactive API documentation.
Add the proper HTTP request headers:
- Accept: */*
- X-Auth-token: {API token value}
When asked, use the Anonymous access option. Authorization has been already handled by the token added to the header in the previous step.
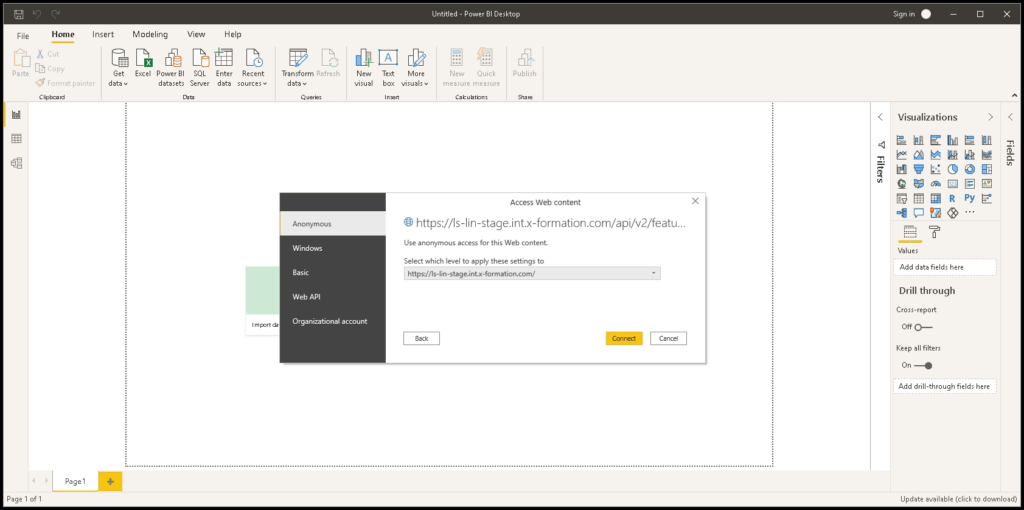
Use the Connect button to access the defined Web source and get requested data.
Preparing data
Data received from the License Statistics API must be formatted before you can read it.
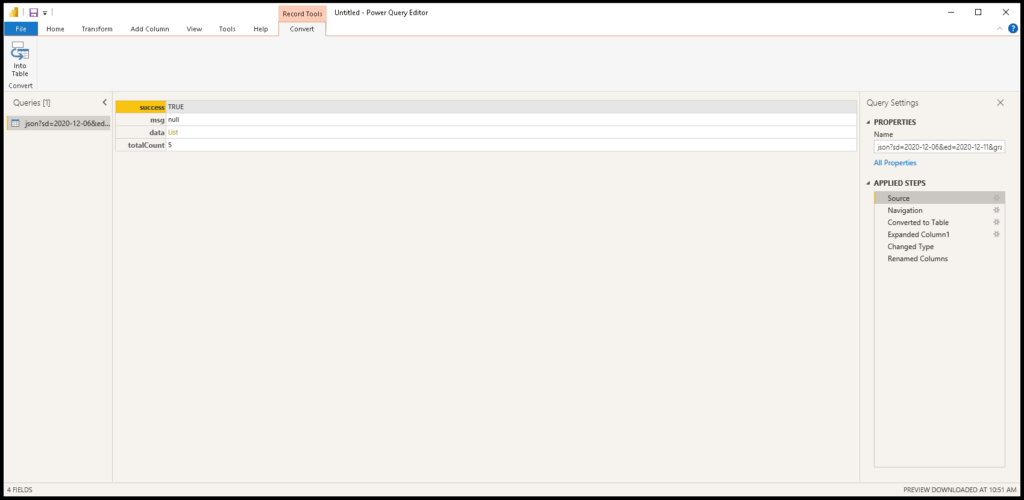
Use the List link to navigate to the data key details.
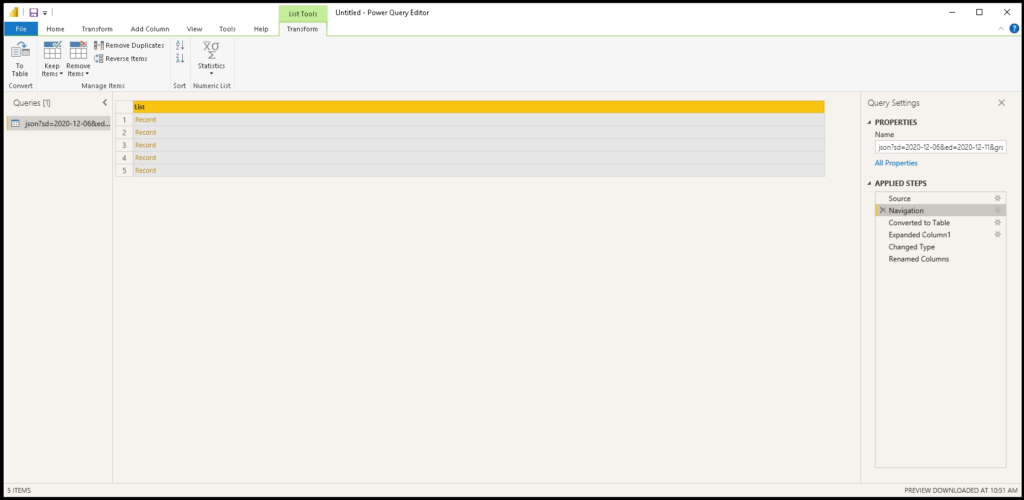
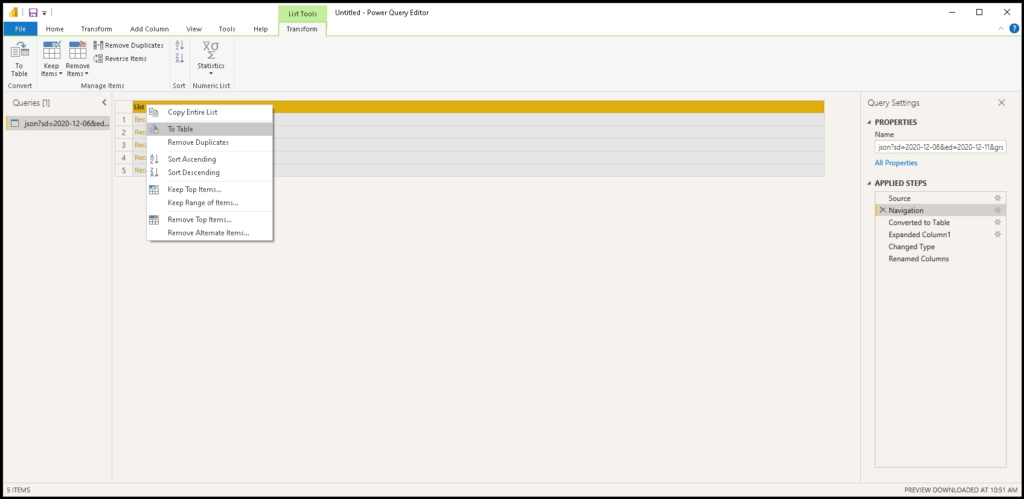
Convert the list of records to a table using the To Table option.
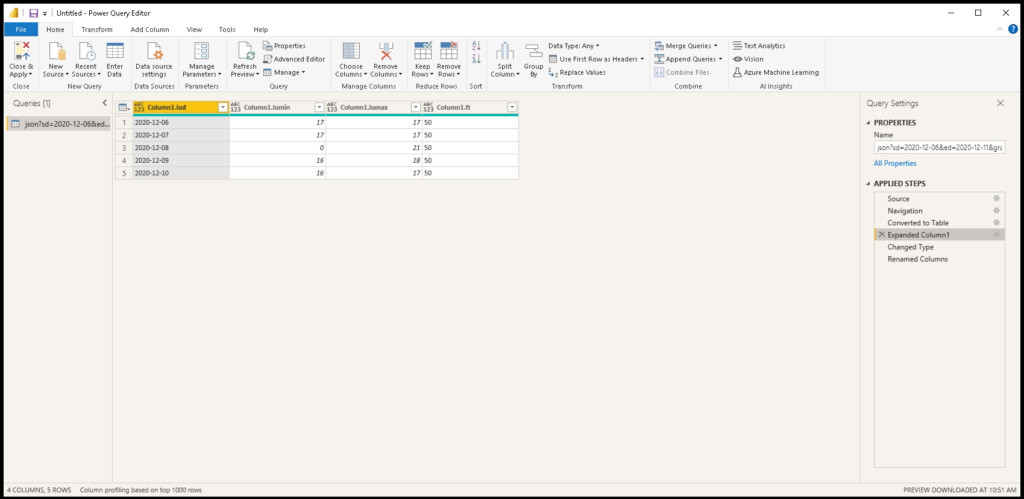
Your results are displayed as shown below.
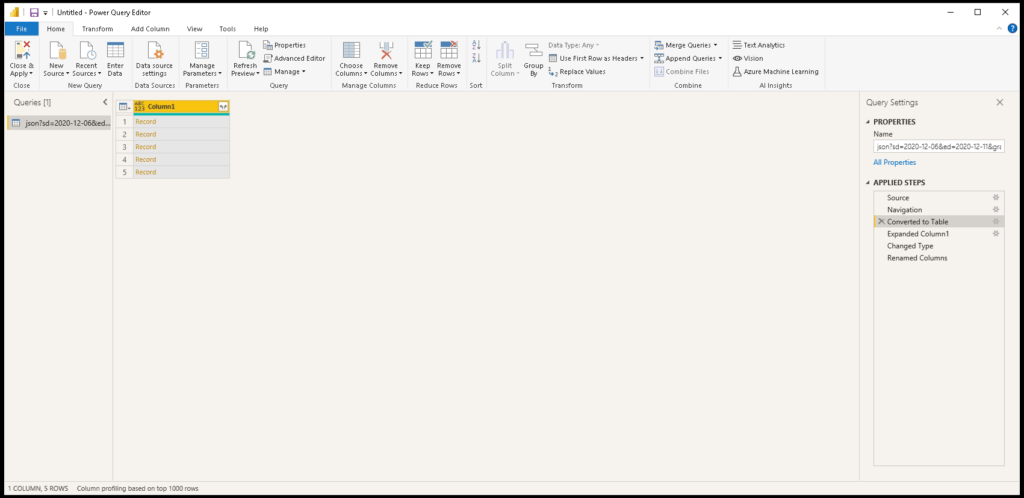
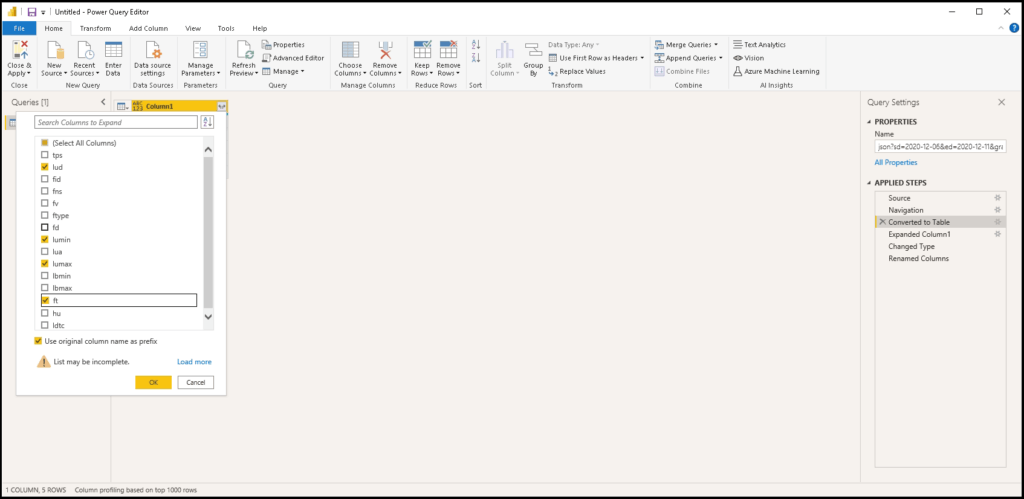
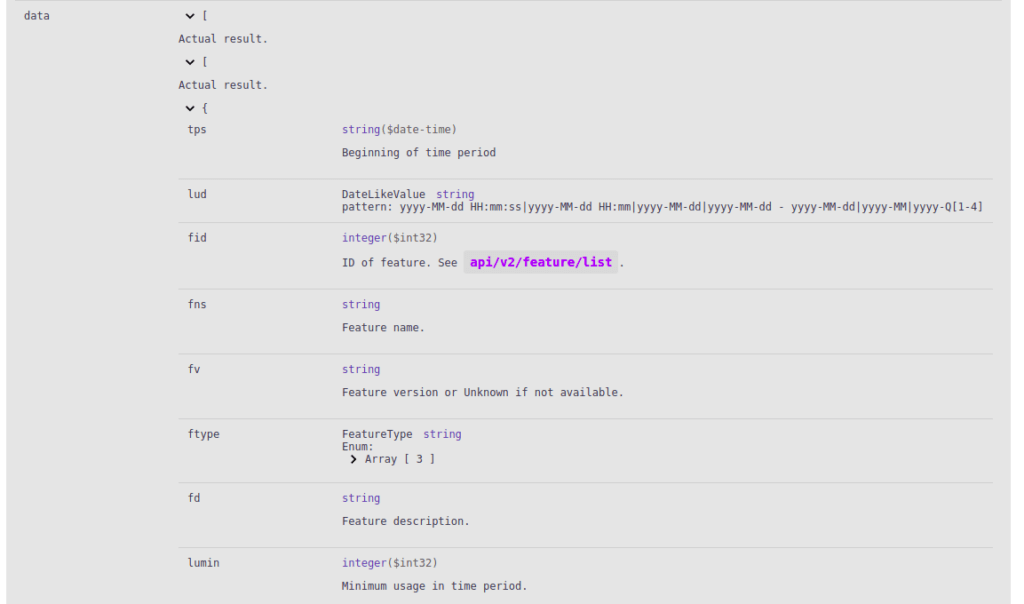
The resulting Table of records can be expanded to include multiple columns. We don’t need all the fields from the response to achieve our goal, so we’ll select only those which are needed in our scenario:
- lud (date)
- lumin (min used)
- lumax (max used)
- ft (total)
Note: You can also set a list of returned columns using the fieldsVisibility request parameter.
The table will be expanded to a multi-column view.
Note: A full list of the parameters with description is available in the interactive documentation.
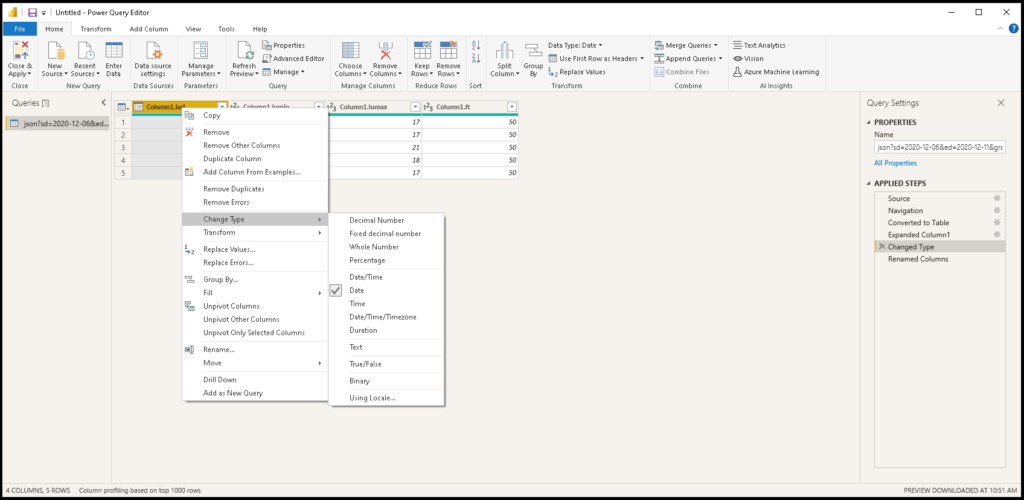
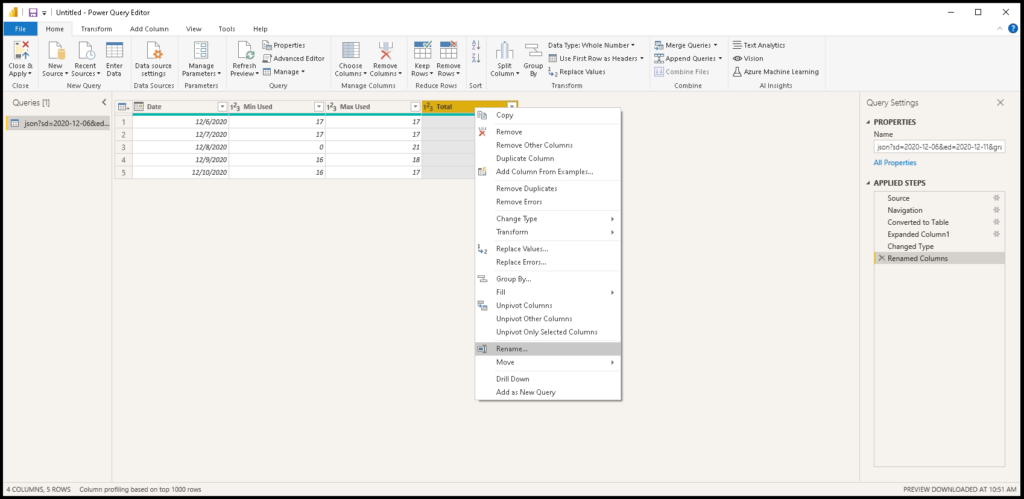
For proper processing we need to define the type of data for each column. In our case, the lud property is a Date type, while the rest of the properties are Whole Numbers.
Rename the columns to present them more clearly in reports.
Creating a Report
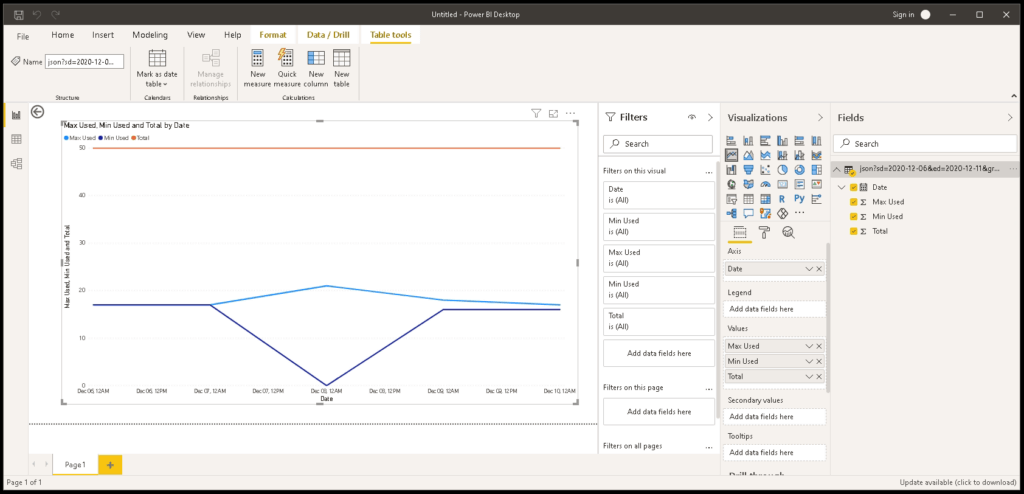
Once you have prepared the data source, you can use the data to create your custom report. We chose to create a line chart. On the X Axis there is a Date, and on the Y Axis we have values from 3 data series: Max Used, Min Used, and Total.
You can see from this basic example that with powerful visualization tools like Microsoft Power BI and rich data from the License Statistics API you can bring even greater value to your company in the areas of license management and optimization.
As always, the X-Formation team loves to hear your feedback and suggestions for new features. If you have ideas or need help, please contact support@x-formation.com or contact your X-Formation representative.