Gain deeper insight into User History data than ever before with License Statistics v6.9. The new User History Gantt chart lets you view license use for a selected feature by user session on any day or time you choose.
Starting with v6.9, License Statistics provides even more granular data about User History. You can now see all sessions for users who use licenses for any feature you select, on any date or at any time you choose. The new User History Gantt chart, part of the Usage Calendar, presents the data you want in a simple, easy-to-read format.
The Usage Calendar and Session History Charts
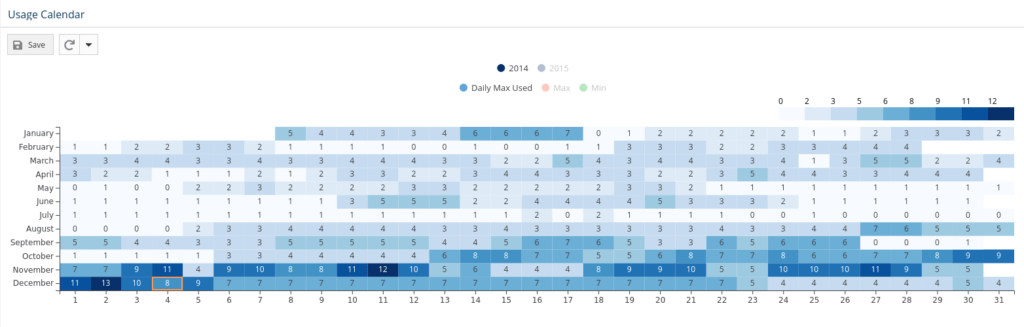
The Usage Calendar shows daily maximum usage of a selected feature for a chosen date range you choose in page settings. The chart is a heatmap with the month on the vertical axis, and the day of the month on the horizontal axis.
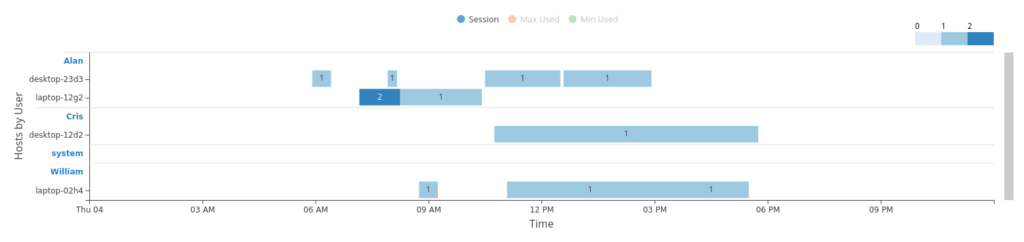
The Session History chart displays a Gantt chart showing user sessions for concurrent hosts.
Viewing the Usage Calendar
You can view data for any date or range of dates with the Usage Calendar.
You can even view the entire year at once, and easily switch between years using the buttons in the legend above the chart.
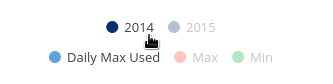
The Usage Calendar shows both minimum and maximum usage for the date range you selected in settings, and for the year selected on the chart’s legend.
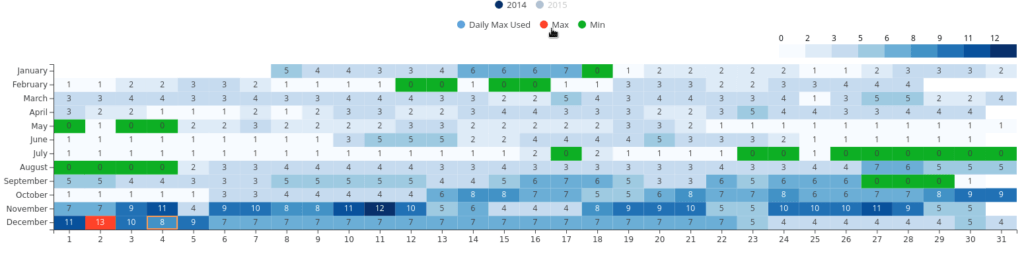
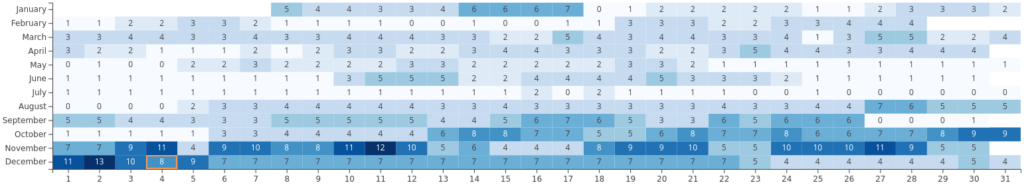
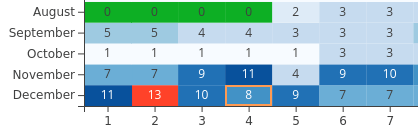
Click any day to view its Session History chart, where you will find detailed data about usage on that day. The day you select is marked with an orange border.
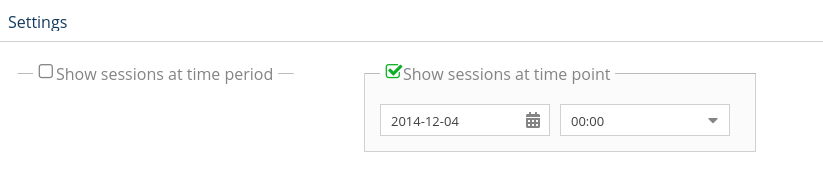
Note: When you are viewing the session at a selected time point, the Chart is hidden.
How to View the Session History Chart
- Go to Features → User History page.
- On the Usage Calendar, click the day you are interested in. (If you are on the Settings page, you can use the “Show sessions at time point” section to go directly to any day you choose.)
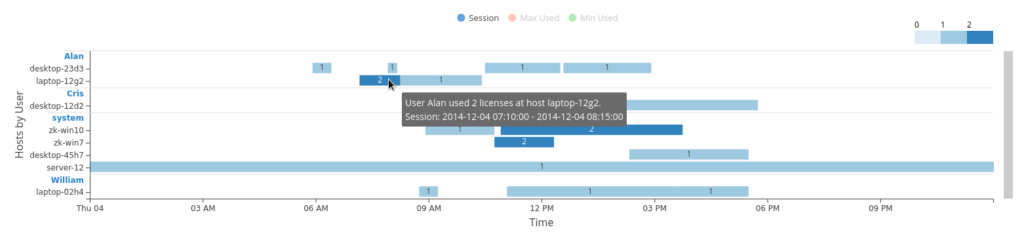
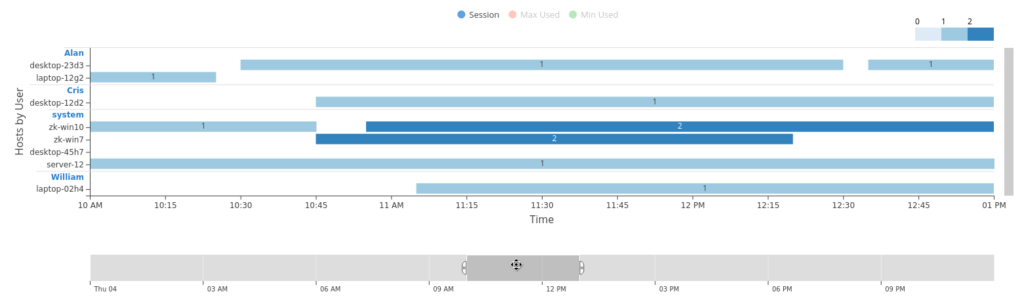
Your Session History chart for the chosen day will then display a Gantt chart with user sessions for concurrent hosts.
How to Use the Session History chart:
The Y axis of the Session History chart groups all hosts by user.
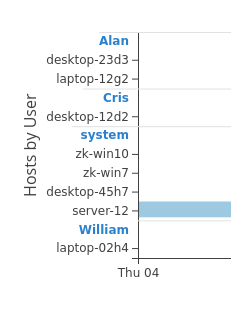
Click the user name (highlighted in blue) to expand or close the hosts view for that user:
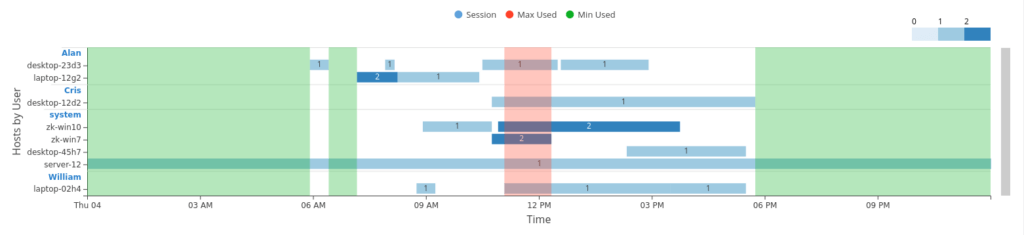
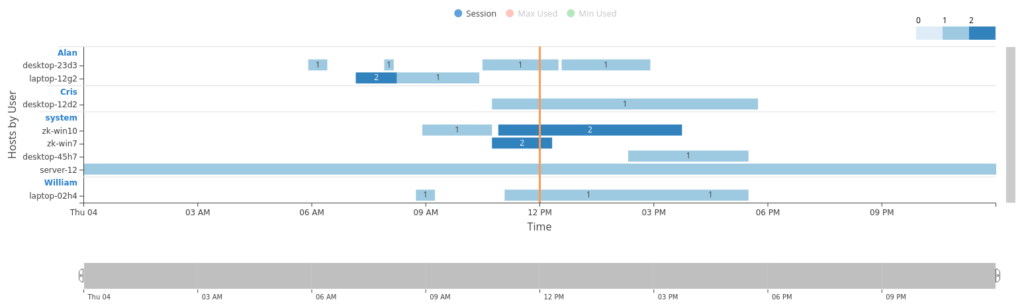
Click Max Used or Min Used to highlight extremas in user data:
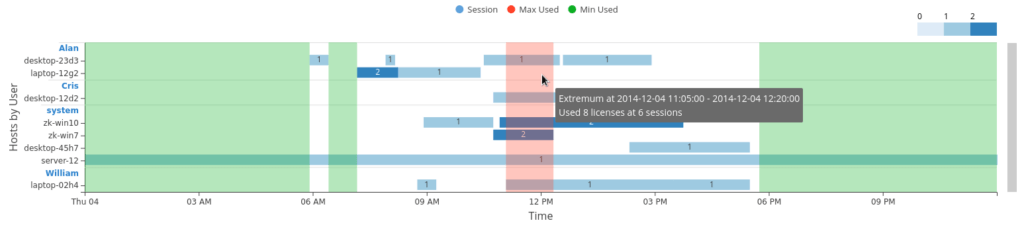
Hover the pointer over an extremum, and a tooltip appears providing more information about the extremum:
Use the time range brush below the chart to set the range of time you wish to view, or use it to create a PNG report file for a smaller range of time:
Select a specific point in time to view sessions at that time point:
As you’ve seen, License Statistics makes it easier than ever to gather the User History data you need to make better decisions. The data you want is presented in a way that gives you greater insight into license usage throughout the organisation. Try the new features and see for yourself.
As always, the X-Formation team loves to hear your feedback and suggestions for new features. If you have ideas or need help, please contact support@x-formation.com or contact your X-Formation representative.