In this second article addressing license management during the COVID-19 crisis, we show you how to use License Statistics to gain useful insights into your software licenses – and the ability to control how those licenses are being used.
As the COVID-19 pandemic continues, companies find that settling into this “new normal” has its share of challenges. Tracking changes in license usage is key to maintaining operations and keeping costs down today. Here are a few tips for making the most of your software license investment by using the tools readily available in License Statistics.
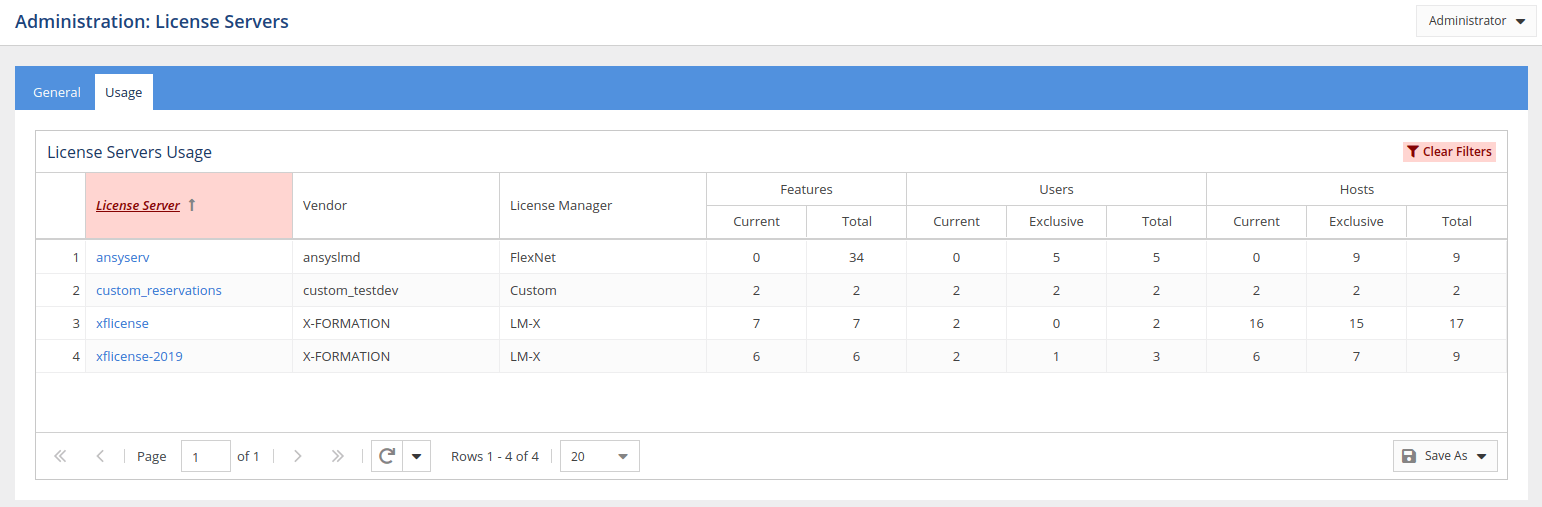
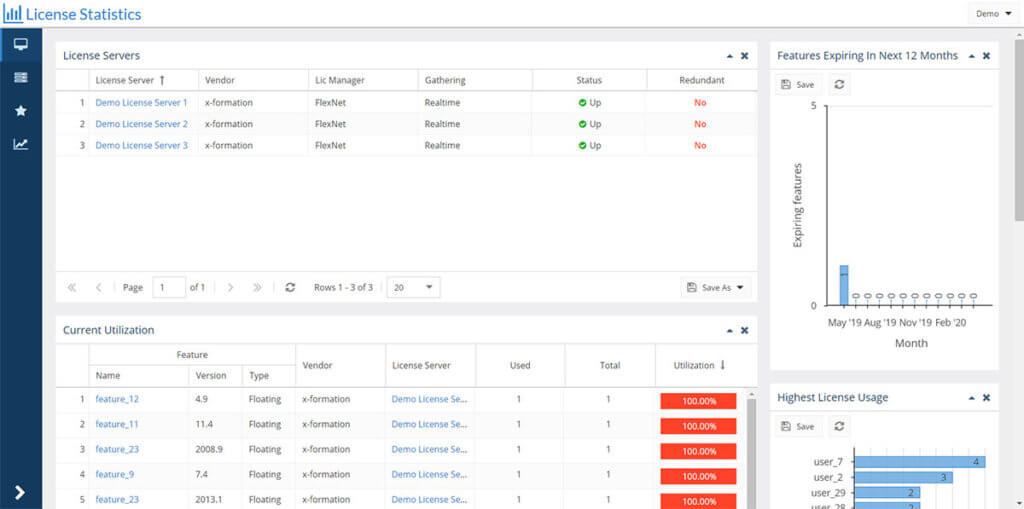
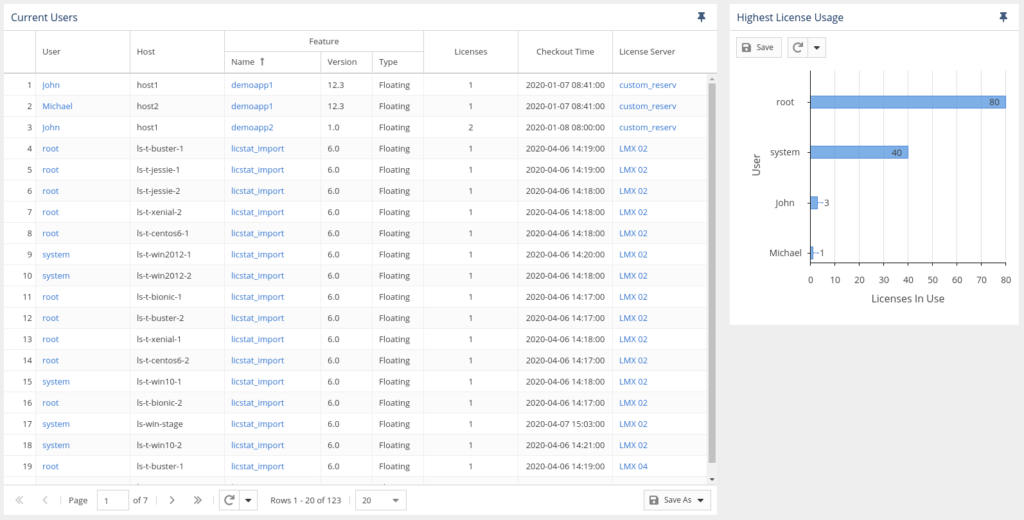
- As personnel shift or go on furlough, license utilization is likely to vary quite a bit as your company continues to adjust. For example, you’ll probably find that the number of unused licenses will suddenly grow with staff reductions and moves. You’ll find, too, instances where too many licenses are being used by the same user on multiple hosts. Where can you gather this information?In License Statistics, all current and real-time reports give you immediate insight into license utilization. The reports most useful for tracking purposes are:
- Current Users and Usage Per User reports.

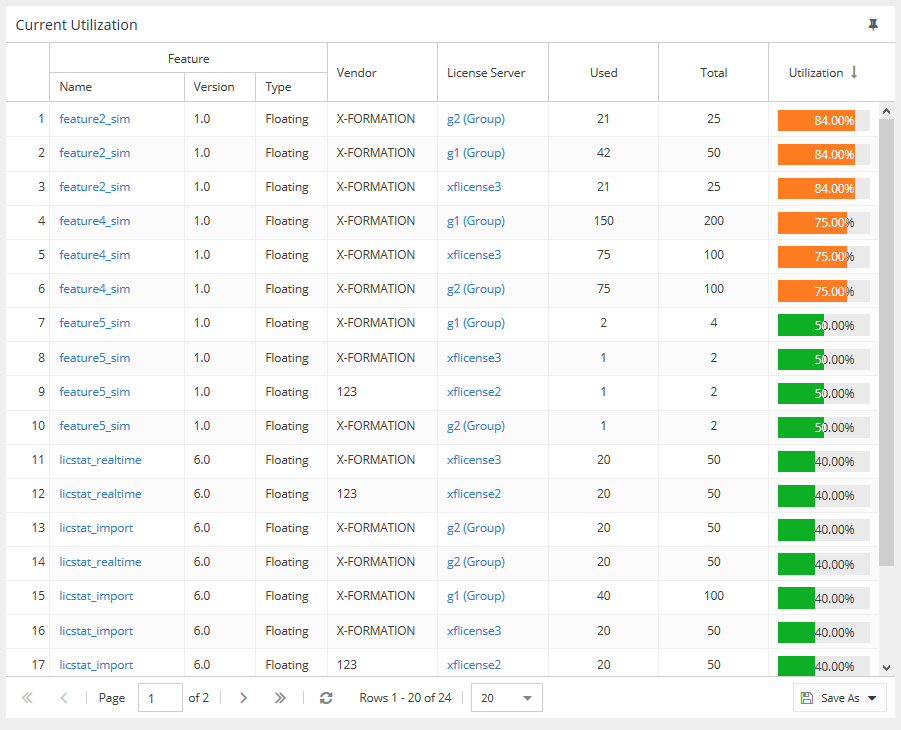
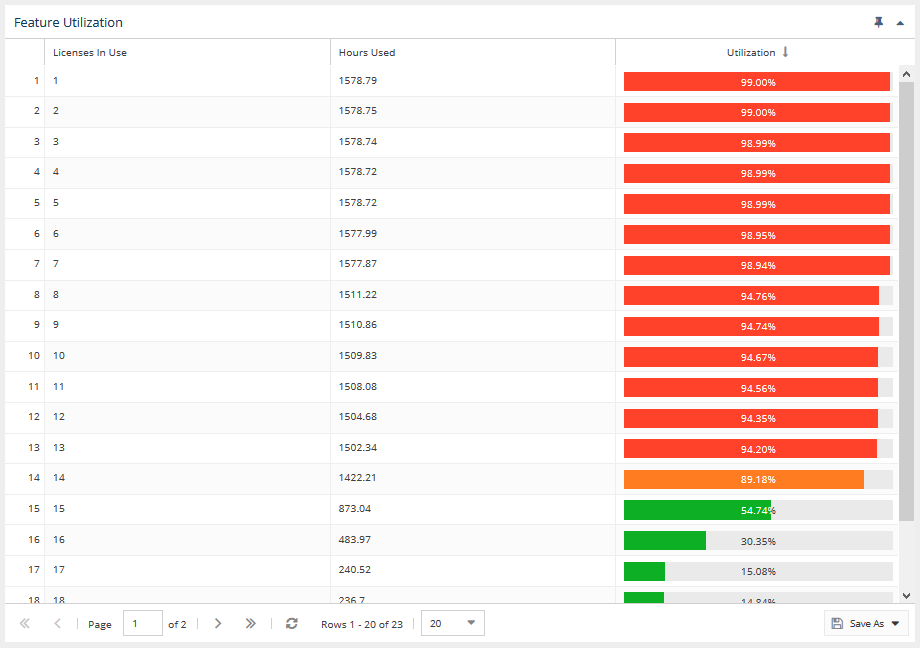
- Current Utilization report.

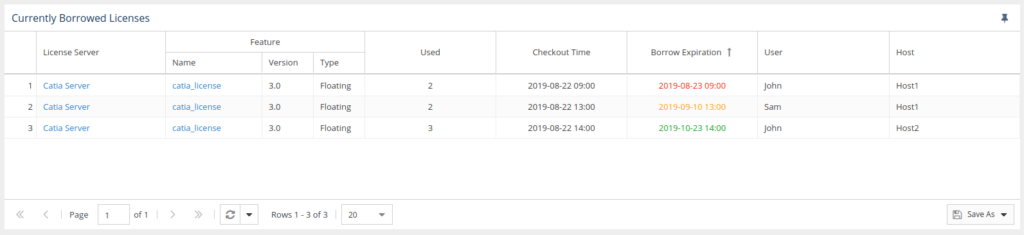
- Currently Borrowed Licenses report.

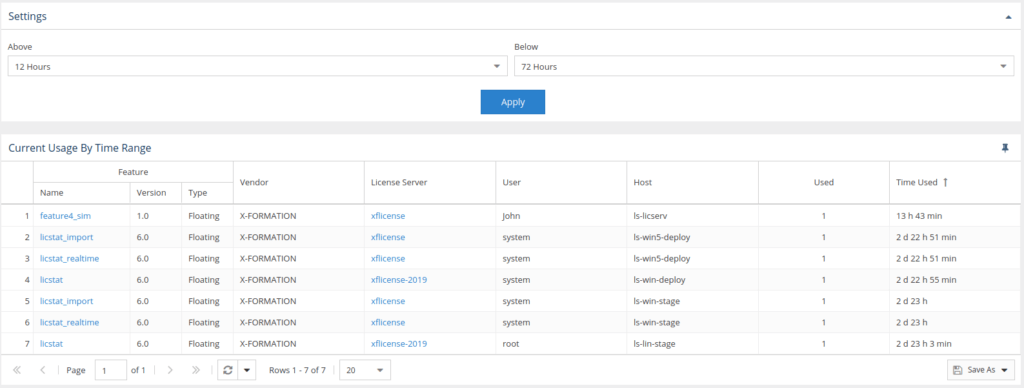
- Current Usage by Time Range report.

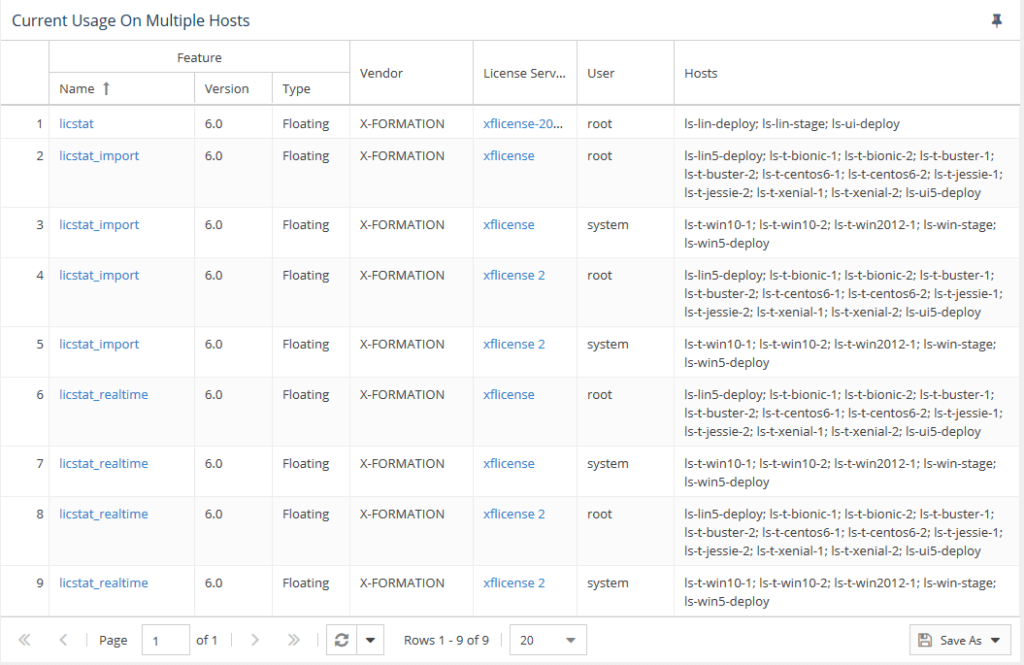
- Current Usage on Multiple Hosts report.

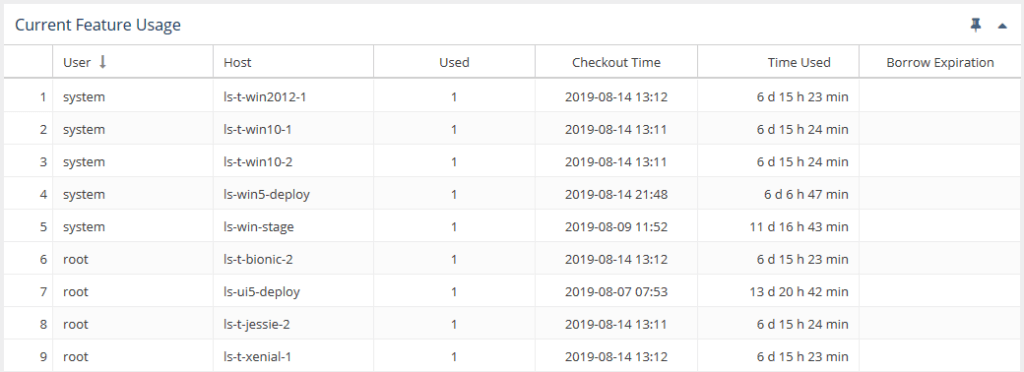
- Current Feature Usage report.

- Current Users and Usage Per User reports.
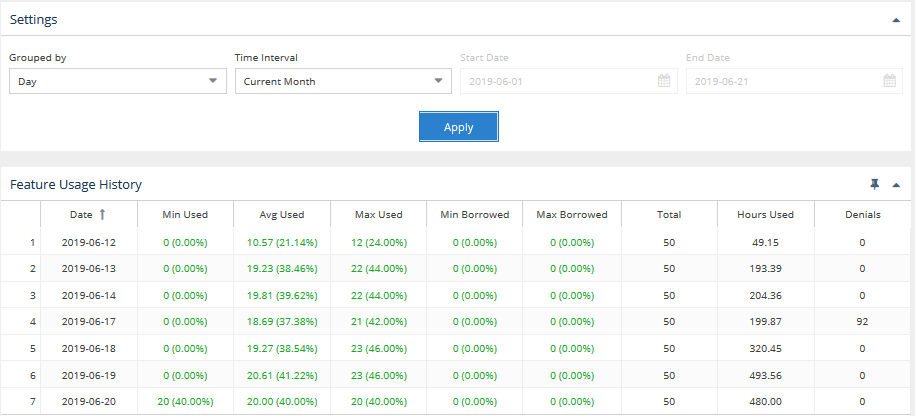
- Use the information License Statistics provides to predict future license needs based on historical reports showing real license consumption. For example, if Utilization for a period of time is lower than expected, the Usage History Comparison report can show you where to make adjustments. Other useful reports:
- Feature Usage history report.

- User History report.
- Utilization History report.

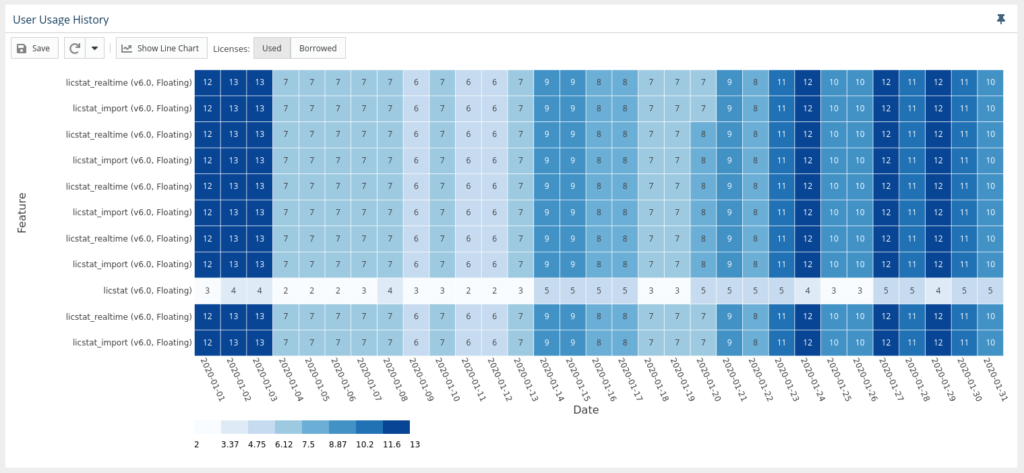
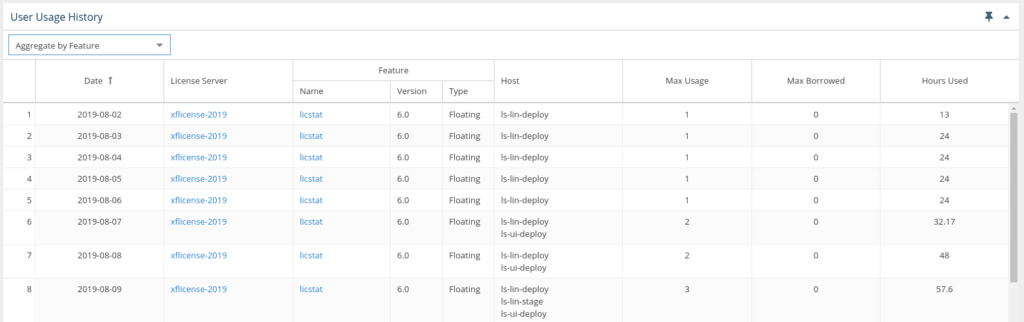
- User Usage History report.

- Feature Usage history report.
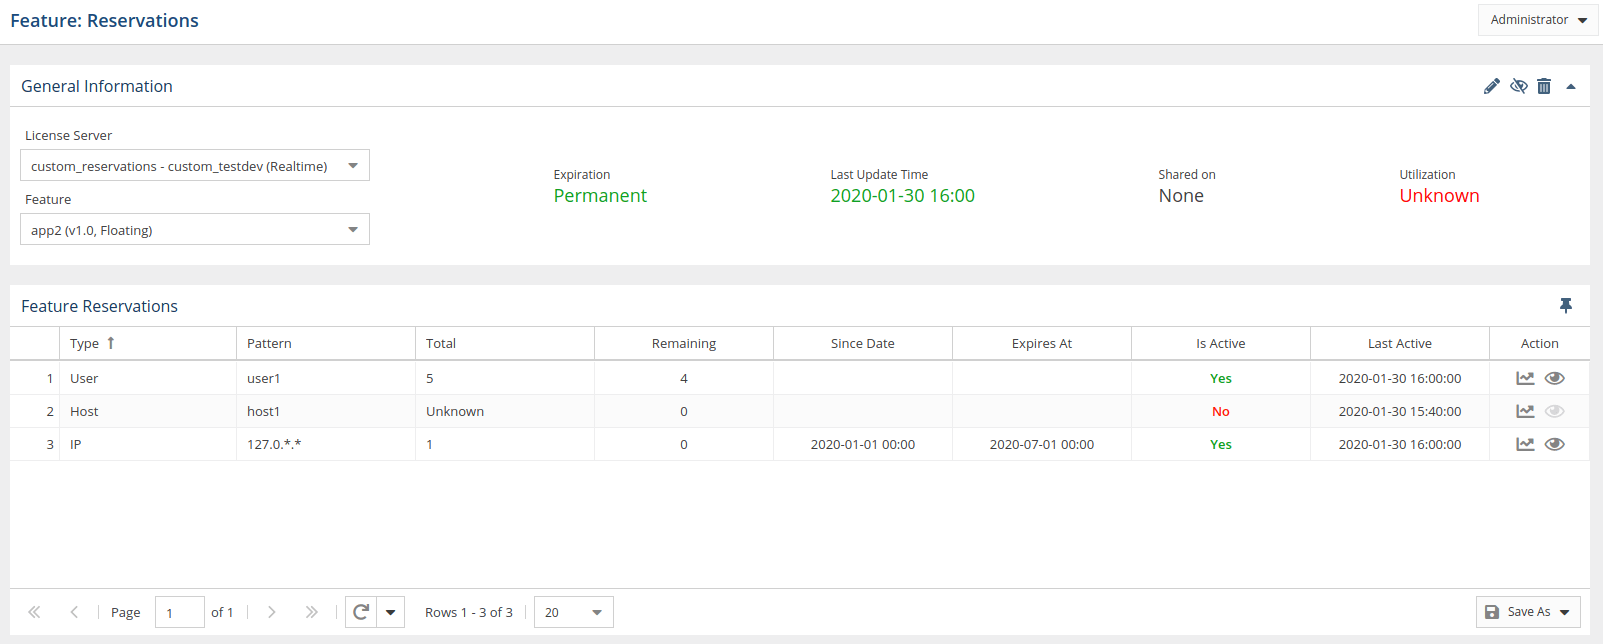
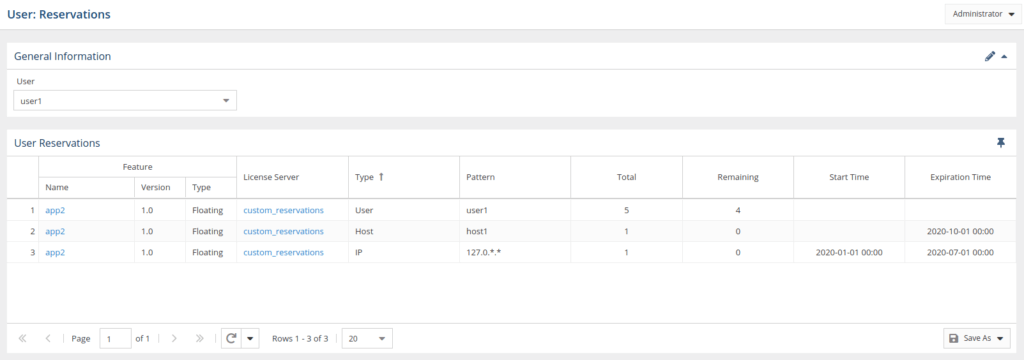
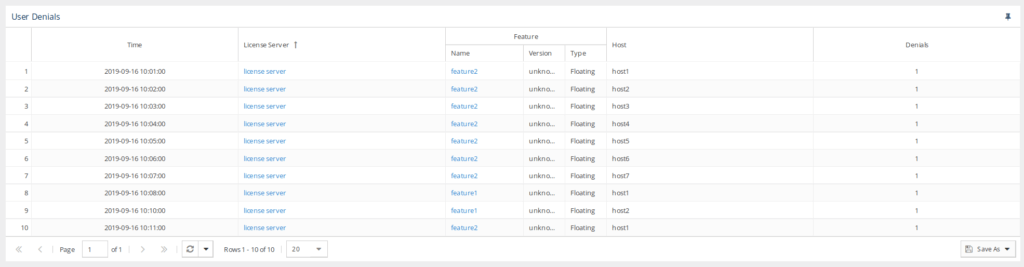
- The Feature Reservations History report can provide information about unconsumed reservations that could easily be used by other people. Use it in combination with the User Denials report for the same feature and time frame to get complete details.


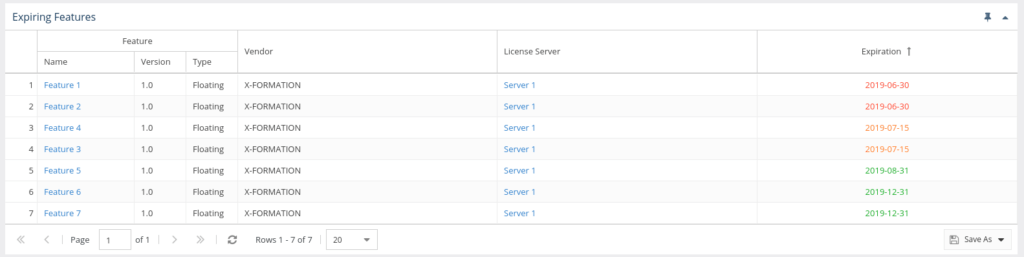
- You can use the Expiring Features report to see an overview of when features are expiring. This allows you to plan for (or even delay) future payments for the licenses until the expiration date gets closer.


We believe that you should remain in control of your business. License Statistics enables you to do just that as you can continuously scale licenses up or down as your workforce changes.
In the light of the current situation we urge everyone to do what is necessary in the situation: Stay home, practice social distancing and cut down on your unnecessary licenses.