Introducing DSLS Restricted Access Mode

License Statistics v6.5 now provides support for DSLS restricted access mode passwords

Many of you have been asking for DSLS restricted access mode support when configuring Dassault license servers. With License Statistics v6.5, you can provide a password for restricted access mode during DSLS configuration when adding or editing a Dassault license server.

Here’s how it works.

Entering a Restricted Access Mode Password When Adding or Editing a Dassault License Server

DSLS Restricted Access Mode

To enter a DSLS restricted access mode password when adding or editing a Dassault license server:

  1. To edit an existing license server, click the Edit icon in the Action column of the Realtime License Servers grid row for the license server you want to change. An Edit License Server dialog opens to allow you to change the existing settings for that license server
  2. Alternatively, to add a new license server, click Add at the bottom of the Realtime License Servers grid. An Add New License Server dialog opens to allow you to configure the new license server.
  3. As you complete the information in the Add New/Edit License Server dialog’s License Server tab, enter the DSLS restricted access mode password into the “Password” field.
  4. Proceed with configuring the license server.

See sections “Adding or editing a realtime license server” and “Realtime License Server settings” on the Adding and editing realtime license servers page for details.

Get to know License Statistics

How to View Usage History with Heat Maps

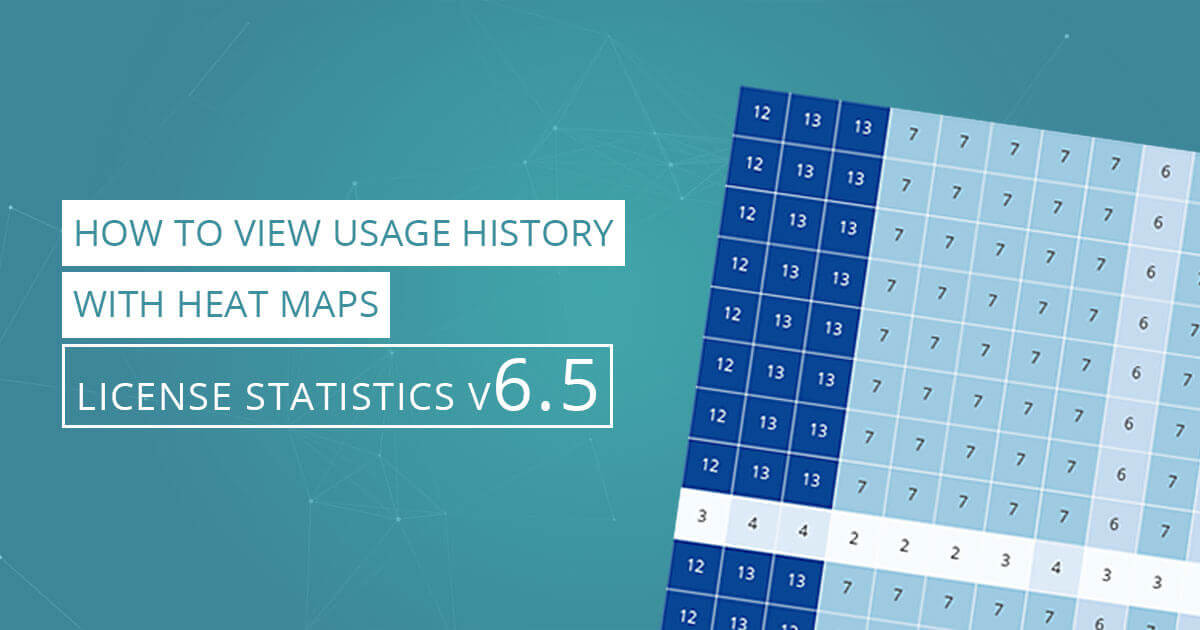
With License Statistics v6.5 you can view the Usage History Graph as a heat map in which Usage History values are represented as colors. The Usage History Heat Map provides a graphical representation of the number of licenses used by the selected user/user group for a specified time period. 

One of the tools introduced in License Statistics v6.5 is the Usage History Heat Map, part of the User Usage History page. The Usage History Heat Map can help you quickly identify trends in usage history.

Here’s how to use the Usage History Heat Map.

Viewing the Usage History Heat Map

To view a heat map, select a desired grouping in the User Usage History Settings area. The Heat Map for the desired grouping and time frame is the default visible chart. Click the “Show Line Chart” button at the top of the graph to display the line chart instead. (For details see the User Usage History page.)

Using the Heat Map

The Usage History Heat Map allows you to toggle between Used and Borrowed licenses. The value in each block of the heat map is the number of licenses used or borrowed by the grouping and time range selected in the Settings section at the top of the User Usage History page. The map’s X axis represents the grouping you selected, and the Y axis represents the features used by that grouping in the selected time range.

The darker sections reflect heavier license usage, while the lightest sections reflect lower usage. At a glance you can quickly see license usage trends by date range and license feature set. This intuitive display of statistical data can help you better understand how licenses and license features are being used so you can better plan for optimal usage and license distribution in the future.

Get to know License Statistics

Features and Enhancements in License Statistics v6.5

Features and Enhancements in License Statistics v6.5

Feature and User Reservations, User Usage History heat map chart, new License Servers Usage page lead the list of features and enhancements for License Statistics v6.5.

The v6.5 release of License Statistics brings both new features and customer-requested enhancements to further simplify your software license asset management tasks. Highlights of the new release include the new Feature and User Reservations pages, easy-to-read heat map charts on the User Usage History page, and the new License Server Usage page.

These features are available only with the new License Statistics licensing model.

Let’s dive in.

Feature Reservations Page

The Feature Reservations page provides an overview of all reservations for a selected license server and feature. You’ll find it under the Features section in the left navigation page. (See the documentation for Feature Reservations for more details.)

The Feature Reservations page provides a General Information grid and a Feature Reservations grid.

  • The General Information grid includes identifying information for the license server and feature. You can set the license server and feature of interest in this grid.
  • The Feature Reservations grid shows detailed information for the selected license server and feature.

You can add the Features Reservation grid to the dashboard for quick viewing. 

Once you’ve selected a license server and feature, click the chart icon under the Action column to see the associated Reservation History graph. If the reservation is active, you can also get more details in the Reservation Details section by clicking the View icon under the Action column.

User Reservations

The User Reservations page provides an overview of all reservations across all features and license servers for a selected user or group. You’ll find the User Reservations page under the Users section in the left navigation pane. (See the documentation for User Reservations for details.)

The User Reservations page, like the Features Reservations page, contains a General Information grid and a User Reservations grid:

  • The General Information grid lets you select the user or user group to view reservations for.
  • The User Reservations grid shows detailed information for a selected user or group, based on the pattern gathered from each queried server.

You can add the User Reservations grid to the dashboard for quick viewing.

User Usage History Heat Map

In License Statistics v6.5 you can now view the Usage History Graph as a heat map. Once you select a desired grouping in the User Usage History Settings area, clicking the “Show Heat Map” button at the top of the graph displays the heat map.

The heat map version of the chart allows you to toggle between used or borrowed licenses. The X axis of the heat map reflects the grouping you selected, and the Y axis reflects all the features used by the user or group in the selected time range. Where the axes overlap is the number of licenses used, and the background coloring corresponds with the scale.

Refer to the documentation for details on the User Usage History page.

License Servers Usage Page

The new License Servers User Page allows administrators to monitor statistics about how each license server is being used. You’ll find the License Servers Usage page under the Administration section in the left navigation pane.

Administrators can use the License Servers Usage grid to get details on the number of features, users, and hosts in the database for each license server. Hover your cursor over any number in the grid to see a list of users/hosts/features included in the reported count.

Of course, we’ve also enhanced a few things to improve usability and application behavior. To discover more about the new features and enhancements, consult the Release Notes for License Statistics v6.5.

Get to know License Statistics

Features and Enhancements in License Statistics v6.3 and v6.4

Customizable branding tools, interactive API documentation lead the list of features and enhancements for License Statistics v6.3 and v6.4.

The v6.3 and v6.4 releases of License Statistics bring both new features and customer-requested enhancements to further simplify your software license asset management tasks. Highlights of the new release include a new User Usage History report, customizable UI elements for branding, and interactive API documentation.

What’s New?

License Statistics v6.3 and v6.4 bring the following new features:

  • A new User Usage History report that allows you to get usage history for a selected user or group.
  • The ability to customize UI elements for branding purposes.
  • Interactive API documentation embedded in the user interface using Swagger (https://swagger.io)
  • Ability to group by year on the Usage Per User report.
  • The ability to delete old, unneeded data from the License Statistics database.

Most of these improvements come thanks to your feedback – your success is our success. The new features added in the v6.3 and v6.4 releases are highlighted below. (Refer to the License Statistics v6.3 and v6.4 Release Notes for a complete list of enhancements to existing features.)

Administration Groups

New User Usage History Report

We’ve been busy enhancing the User Usage History Report over the past few releases, starting with v6.2 in which we introduced the ability to view license usage history by Current Usage and Denials. With the v6.3 release, the User Usage History report now gives you the ability to view license usage history by a selected user or group (available only with the new licensing model). The report makes it easy to select the user/user group for which you want to view usage history and specify time intervals to include in the results.

To view the report, select the Usage History page under the Users section in the left navigation pane. Remember, you can also add the Usage History grid and graph to the License Statistics Dashboard for fast and easy tracking.

User Usage History

Customizable Branding of UI Elements

One of the big features you’ve asked for is the ability to apply your organization’s branding to the LIcense Statistics interface. With the new release you can now add your company logo to certain UI elements, display a custom favicon, and make other changes to reflect your corporate identity. Use the Branding section in the Miscellaneous page, located under the Administration section of the left navigation pane. (You must be an Administrator to make these changes.)

You can customize:

  • The application name displayed in the browser title, footer, exported reports, and email templates.
  • The logo image displayed on the login page, above the navigation pane, in email notifications, and in exported reports.
  • The favicon image.
  • Visibility of the footer containing the X-Formation logo and versions, displayed in the UI and in email notifications.

For details on customizing License Statistics and the requirements for logo images and favicons, refer to the License Statistics documentation.

Interactive API Documentation

For your quick and easy reference, you can now get interactive API documentation directly on the API page using the embedded Swagger application. The interactive documentation is always up-to-date, so you can set up API calls knowing you have the latest information.

The new interactive documentation makes API development even easier thanks to the following features:

  • Test and run examples directly from the License Statistics UI.
  • Get immediate access to all return codes and parameters.
  • See built-in examples of the types of calls you can make.
  • Simplified authorization requests: The API documentation tool automatically authorizes requests with the current user token.

The interactive API documentation contains endpoints related to all reports, as well as charts including user, license server, and features scope.

API Endpoints

Group by Year on the Usage Per User Report

The Usage Per User Report now gives you the ability to group reports by year. When you limit license usage information to a year, you’ll see usage within the selected year based on daily usage. Doing so gives you a bigger picture of high usage trends, helping you spot infrequent but important spikes in usage.

Delete Old Data from the License Statistics Database

Administrators are now able to remove data older than the previous calendar year from the License Statistics database. To do so, select the Database Management tab from the Administration page.

Data Removal

Data Removal

If, for example, the current date is February 5, 2020, you will be able to select dates starting January 1, 2019 and older only. (You cannot remove data from the current or previous calendar year.)

Things to remember:

  • Once you confirm deletion, License Statistics will schedule the deletion to occur when you restart it. (You can always cancel any time prior to restarting.)
  • Plan deletion carefully. The process can take hours to complete, depending upon the amount of data you select. No data is collected during the deletion process, so be sure to schedule the deletion during non-critical hours if possible.

Of course, we’ve also enhanced a few things on the back end to improve usability and application behavior. To discover more about the new features and enhancements, consult the Release Notes for License Statistics v6.3, v6.4, and v6.4.1.

Get the Data Your Way: The License Statistics API

Of course you know License Statistics delivers the data you need to control license and license server costs. But did you know you can also display all that great data in the BI dashboards and reports you already use every day?

That’s right: The License Statistics API makes it easy to extract the data you need and integrate it into your own business processes. Display critical license data along with the other key indicators you track daily in reports, dashboards, and other BI tools. Use the API to automate report generation and make it readily available to your manager or a specific department in your organization.

The License Statistics API is an invaluable tool for advanced users and systems integrators who want to create their own views into critical business data. The License Statistics UI shows you just what can be done with the API, as it uses the same API to display data in your web browser. 

With the License Statistics v6.3 release, interactive API documentation is now embedded in the UI using Swagger (https://swagger.io/).

Getting Started with the API

The API gives you flexible, on-demand access to License Statistics data in an easy-to-extract format. You can request results in JSON, csv, PDF, or xlxs formats, so you have a wide variety of options for accessing and using the data. Use the API with your custom external applications, off-the-shelf BI tools, and reporting systems.

Getting started with the License Statistics API is as simple as enabling API access, generating a token, and making your first API request. Once you have enabled API access in your License Statistics account, you then generate an access token. 

Generating and Using API Tokens

API access tokens are unique identifiers associated with your account that are used to authenticate your data requests in the API. Tokens cannot be shared, so you’ll need to create a token for every user requiring access.

Once you’ve generated an API access token, you’ll add the HTTP header “X-Auth-token” to every request you make. Make requests directly using your web browser, or use an HTTP client like cURL to get the data in a variety of useful formats. Here’s a cURL example:

curl -H "X-Auth-token: token" "http://yourdomain/url-to-api"

Making API Requests

A basic API request uses the GET method to pass report parameters in a query string. The basic API request looks like this:

curl -H "X-Auth-token: token" "http://yourdomain/url-to-api?parameter=value&parameter2=other_value"

(“yourdomain” is the URL on which License Statistics v6.3 is installed.)

Any data you can see in the License Statistics UI can be accessed using the API and brought into your reporting tools. There are 18 API endpoints provided by License Statistics, each of which delivers specific license usage metrics.

Useful Examples

Example: Return a list of all features recognizable by License Statistics

The cURL command:

curl -H “X-Auth-token: token” “http://yourdomain/api/v1/feature/csv

will return a csv format file containing one row for each feature recognizable by License Statistics.

Example: Return a list of feature information filtered by name and version, output to csv format

The cURL command:

curl --data "filter=[{\"type\"=\"string\", \"field\"=\"fn\", \"value\"=\"abc\"}, {\"type\"=\"string\", \"field\"=\"fv\", \"value\"=\"2.1\"}]" -H "X-Auth-token: token" "http://yourdomain/api/v1/feature/csv"

will return a csv format file containing one row for each feature, filtered by name and version.

Example: Return information in json format for a feature with an ID of “1”.

The cURL command:

curl --data-urlencode "filter=[{\"type\"=\"numeric\", \"field\"=\"fid\", \"comparison\"=\"eq\" \"value\"=\"1\"}]" -H "X-Auth-token: token" "http://yourdomain/api/v1/feature/json"

will return a json file containing the information about the specified feature.

Conclusion

The License Statistics API is an easy-to-use tool for integrating License Statistics data into your own business processes. Ready to get started? Go to the “Using the License Statistics API” section of the online documentation for complete details.

Is There Money Hiding In Your Floating Licenses?

Allocating Floating Licenses Across Time Zones – Best Practices

Smart license management practices are the key to effective use of floating licenses and reducing their overall cost. If your company has many users across international time zones, you can realize a significant cost savings if you know how many licenses are in active use at any given time. License Statistics is your key to unlocking those savings.

Identify Users by Time Zone

The first step in better allocating floating licenses across time zones is to identify the groups of users in each time zone. In License Statistics, you can use the Usage History view to determine exactly when users are actively using the software. For users in different time zones, you will see their usage rise as their work day begins, or see it drop as they finish their work days.

You will also want to check current usage above 24 hours to see where users have left software running without logging out. Assess those users separately, and create a strategy to mitigate those temporarily “lost” floating licenses. Having an accurate picture of floating license usage is the first step in reducing floating license costs.

Determine Actual Floating License Usage

Once you’ve sorted users or license servers by time zone, you have a clear picture of which users are using licenses and when they are using them. License Statistics provides many views into the data you can use to help develop a complete picture of usage. For example, the License Server Usage History enables you to sort server usage history to quickly identify maximum (and minimum) usage. The Usage by User Report is also invaluable in identifying peak users and usage.

License Server Usage History

Usage by User Report

You will immediately see usage patterns emerge from the data, and across time zones you will be able to identify times during which usage for users in one time zone drops off as users in another time zone are logging on. They are non-concurrent users; you can therefore see the opportunity to decrease the total number of floating licenses needed – you do not need licenses for users who are no longer at work!

Calculate the Number of Floating Licenses Needed at Any Given Time

Since all global users are not accessing floating licenses at the same time, you can now make a better estimate of the total number of licenses needed based on actual usage across international time zones. Thus, When users are leaving for the day in Mumbai, their counterparts in the US are just coming into work. You therefore need enough floating licenses to support one group of users, not both.

A typical starting point for determining the actual number of floating licenses needed is to begin at the 50% mark. Evaluate usage over a work week using the Usage History reports to determine how many (if any) denials are occurring, then make an appropriate adjustment. Over the course of three weeks you will have determined a solid, workable number you can use – with data backup – to justify the purchase of the exact number of floating licenses needed. 

Conclusion

By making a small change and then measuring results with License Statistics, you will be able to zero in on a cost-effective floating license strategy. Reevaluate floating license usage regularly with License Statistics – you will be amazed when you discover the savings hidden in your software licenses.

In a coming article we will show you how to use the License Statistics API to create your own reports and actually import data into your favorite BI dashboard.

Get to know License Statistics

A Closer Look at the License Details Page in License Statistics v6.0

We not only completely redesigned the interface for License Statistics v6.0, we provided a quick and simple way to see the status of your License Statistics licenses. The new License Details page gives you an immediate picture of exactly what is happening with your users and license servers.

To open the License Detail page, first click the Administrative menu on the left. Scroll down and select License Details to open the License Details page.

Information at a Glance

The License Details page gives you an immediate overview of license servers status, including the number of current users and number of license servers used in an easy-to-read graphic format. You can also quickly check on license and maintenance expiration dates.

The gauges tell you exactly what’s happening at a glance. In the screenshot below, you can instantly see that the number of license servers has been exceeded, and that the number of users is approaching its maximum.

A new Hosts gauge has also been added for License Statistics v6.1, making it easy to see when the number of hosts is approaching maximum.

In previous version of Licenses Statistics, it was difficult to get a clear overview of your licenses, and when your licenses ran out you had to dig through logs to determine what was happening. That’s all in the past with the new License Details page – it now goes into a read-only mode if a license reaches its limits so you can instantly see what’s happening.

Most important, you now know ahead of time when license usage is approaching the limit in one easy-to-read report. Check out the new License Details page today and let us know what you think.

3 Tips for Getting More Word-of-Mouth for Your Business

What’s the most effective form of advertising? The kind you cannot buy – word-of-mouth from your best customers. About 90% of people believe brand recommendations from friends and colleagues, and that’s a number you cannot ignore.

The good news is that you can encourage people to talk about your products and services through a few consistent and intentional practices. Read our tips below and let us know what’s working for you to get good word of mouth for your business.

“Be So Good They Can’t Ignore You”

The comedian Steve Martin shared that advice in his autobiography. It sounds obvious, but the bottom line for getting good reviews from your customers is that the experience they have with your product must be excellent. That means your product must deliver excellent value. Fail to deliver, and people will talk; deliver the best, and people will talk about that, too. 

Ways to ensure your software product is really good:

Storyboard new user interface features and share the storyboards with your best customers. Getting them involved in the design process helps ensure you give them something worth talking about.

We always believe half of the product is the product itself, and the second half is all the people behind it. That’s why our goal at X-Formation is to respond to user requests within 24 hours, and ideally much sooner, so we can make sure they get what they want. Speaking of which…

Give your customers what they want. Maintain an active database of customer enhancement requests, track them, and let people know when their requests are implemented. Get customers involved in the design process.

Talk to your best customers – and your worst. Building relationships with your top customers pays off in many ways. Talk to your top users and listen for ways in which you can help them be more successful in their businesses. Talk to your dissatisfied customers, too. They will help you spot the issues you need to fix. By enlisting them in the process, you may well turn the most difficult customer into one of your best.

At X-Formation we work hard to get feedback, and no feedback is more important than what we get from unhappy customers. They show us where we’ve tripped up and help us ensure we get it right the next time.

Deliver Top-Notch Customer Service

To deliver the best customer service is to plan for it. And it begins with your employees. To quote Sir Richard Branson, CEO of VIrgin Airlines, “Clients do not come first. Employees come first. If you take care of your employees, they will take care of the clients.” Model the behavior you expect from your staff and show them what real customer service looks like.

Ways to ensure your customer service is top-notch:

Create exceptional value. Focus your customer service team on creating exceptional value in every customer interaction. Quick, detailed responses go a long way to making a customer feel like your company really cares about their problems.

Customers respect knowledgeable, timely answers. We make it a practice to answer all X-Formation customer emails with an internal 6-hour deadline (though we tell our customers 24 hours to ensure completeness). We always want to deliver more than our customers expect, and they appreciate our prompt, straightforward answers.

Have a process that tracks customer feedback – both positive and negative – and develop a strategy for responding to both. Create a library of resolution tactics you’ve used in the past to help customer service representatives have resources they can use to soothe a dissatisfied customer.

We give every customer an option to share their feedback on every interaction with the X-Formation team by sharing a survey link at the end of every email. They tell us how we did, and we share the positive ones with the team to let them know a good job has been done. We take negative responses even more seriously, and use them to improve our processes to eliminate future mistakes. This is a big part of being a learning organization.

Deliver everything you promise. Many companies have fallen out of favor simply because they failed to deliver on their promises. Honesty is paramount when working with customers. Keeping them informed about what can and cannot be done sets appropriate expectations and prevents disappointing results.

Bugs happen! When we discover a bug, we inform our customers of what’s happened and let them know as soon as a fix is available. Hiding problems is not good customer service! The X-Formation approach is to resolve bugs quickly, and to never sacrifice quality just to ship something out the door.

Above all, be human. The more you focus on building good business relationships, the happier your customers – and your business – will be.

Ask for It

The best way to get good word-of-mouth for your products is to ask for it. Make asking customers for feedback a core component of your customer service process. When you get really good feedback, post that on your website and any social media sites your organization uses (such as LinkedIn). Treat every customer interaction as an opportunity to build more good will.

Ways to get more customer feedback:

Survey select customers periodically to rate your customer service. Always include the opportunity to rate every customer service interaction.

Two things you can do right now to make it easy for customers to send feedback. There’s always a link in our X-Formation emails and our website footers to give our customers that ability. And because customer feedback is crucial to making progress, we also have our “Feedback for the CEO” page to give our customers every opportunity to give us feedback.

Conduct quarterly roundtables by invitation with select customers on key accounts. What’s working for them – and what isn’t? Use the information you gather to create blog posts, newsletters, and informational webinars.

We don’t wait for our customers to contact us at X-Formation – we frequently ask our biggest customers for their evaluation on our progress. Without them we are nothing, so it’s important to us that we ensure their happiness. Nothing beats a “Thank you – it works” comment. 

Interview customers and create case studies that highlight the successes they are having with your product. Let them tell you how they’re getting the most out of it. You can do case studies in an informal podcast or webinar format, or create a case study article you can use for newsletters, blogs, and marketing handouts.

Here at X-Formation we use blogs and customer meetings to ensure all feature requests get evaluated and taken seriously for future improvements. We’re big believers in customer-driven development. By letting our customers tell us what they really need, we can keep a clear focus on creating the right features.

Customer word-of-mouth is one of the most valuable marketing tools you have at your disposal. Create good relationships, deliver exceptional value, and communicate with your customers and clients as part of a planned process built into your customer service organization.

Say “Hello!” to License Statistics v6.0

It’s here: License Statistics v6.0 has arrived, with a crisp, responsive interface, streamlined navigation, and new features based on your feedback. There is also a new license model designed to give you double the features at the same price. Read on to discover what’s new.

Crisp, Responsive Interface

Meet the new sleek, high-resolution interface with a larger viewing area for exceptional usability. It’s been redesigned to look great and works flawlessly across all devices, including tables and smartphones. The interface makes customizing your view of the data easy and flexible, too. Lay out the panels in the Dashboard exactly as you want to see them by dragging and dropping panels from one location to another.

License Statistics Layout

Data presentation now happens quickly and automatically, with no page reloads and no extra wait times. Navigation has been streamlined as well, with a vertical menu that is collapsible, allowing you to maximize the data viewing area.

You can now read and manipulate grids, charts, and forms with ease thanks to the new layout and improved color scheme.

License Statistics Layout

Faster and Easier to Maintain

License Statistics v6.0 has been rebuilt to be much faster than previous versions. The application is now cached in the browser, using local storage for the fastest response possible. There’s no extra wait time and no page reloads.

It’s easier to administer and maintain, too. The user interface is all generated by the JavaScript framework, eliminating HTML generated by PHP.

We’ve also changed how License Statistics v6.0 handles situations in which its license is exceeded or has expired. Rather than shutting down the application, it continues to run License Statistics v6.0 in read-only mode for user convenience until the license issues have been resolved.

Enhanced Notifications and Status Information

We not only completely redesigned the interface for License Statistics v6.0, we enhanced the notifications you receive about different actions to help you make better decisions about your software assets. You asked for more license server information in the interface, and we built it for you. The new License Detail page gives you even more information on license server status – detailed state information and more complete descriptions of exactly what is happening with your license servers.

New License Model

License Statistics v6.0 brings a new license model that gives you double the features at the same price. With the adjusted license model you’ll have access to all product features. You’ll be able to choose whether you wish to monitor your license servers in real time, or use data imported from report logs.

The upgrade to the new License Statistics v6.0 license model costs nothing and is optional — you can either upgrade or keep your existing licensing.

Please contact our customer support team for any questions regarding the license model revision, or about upgrading to License Statistics v6.0.

Read a full list of release notes to stay on top of all changes introduced with each release.

The Founding of X-Formation and How the Company have Replaced the Word “Failure” with “Lessons”

Today, we spoke with Henrik about the founding of X-Formation and all the lessons learned in the years the company has been around.

Henrik Goldman founded X-Formation in 2004, and over the past 15 years, the company has come a long way. We have expanded our headquarters and are opening an R&D office. Today, we’re going to look at how far we’ve come and the things we have learned over time through an interview with our founder.

Interviewer: How did you get your idea or concept for X-Formation?

Henrik Goldman: “The idea came about when I was looking at professional products in the field. I was so frustrated about the poor quality of them, it got me saying to myself, ‘I know I can do better.’ The motivation was to give customers better value for their money. For 15 years, this has been the motivation and still is. What’s important to us is giving customers a quality product with good and fast support so they know they found a good business partner.”

How many employees do you have?

“25 people, mostly engineers. We’re an engineering driven company listening to customer requirements and transforming it into solutions.”

What is your ultimate goal or mission for your software licensing programs?

“The goal is to make a difference for customers. It’s a success for me, as the owner, and the team to see customers keep using the software for over 10 years. Collecting as many happy customers as possible, making lives easier for customers, and ensuring that we can be part of their success are all great goals of ours.”

Why do you think X-Formation has been so successful?

“Because of our customer focus. Not many software companies are able to survive for 15 years. In the beginning, many customers asked me personally if the company would still be around after 5 years. 15 years later, I’m sadly not able to answer that since those customers’ companies don’t exist anymore. For those that still do, we’re proud to be part of their success story.”

“Constant focus on the customer and ensuring their happiness is what makes the difference. We’re small compared to many large players, which makes it very important for us to be agile.”

What has been your biggest success with the company?

“To survive for 15 years and to celebrate it with some of the largest companies in the world, many of whom are our customers. Companies generating billions in revenue keep trusting us every day. We’re grateful for that. Having more than 600 companies as our customers keeps us going and growing.”

Have you had failures? How do you learn from them?

“Sadly, most failures have been customer disappointments due to growing pains related to unfit hires. While we strive for the best, it’s not always possible to succeed. Sometimes a bad hiring decision has had an avalanching effect down the line. For that, I’m truly sorry.

The best way to get around this is to quickly resolve whatever problems arise in order to regain trust. Always react fast.

“Fast reactions. Reacting quickly to any problems allows you to correct your mistakes quicker and right your wrongs. Today, I’m proud to be working with a team where all core members have been working with me side-by-side for over five years. It’s remarkable how many good things come out of working with people who you can trust and rely on.”

What would you tell someone looking to get started in the industry or just with their dream?

“Don’t wait, just start! Learn as much as you can, and keep learning every single day! I always say that if you have a talent then it’s your duty to make the most use of it. I am lucky to be in the software industry. An industry I love, and that I find as much a hobby as it is work.

However, success is hard. Work smart.