
Company
X-Formation – Year in Review – 2022
“Coming together is a beginning, staying together is progress, and working together is success.” — Henry Ford At this time


“Coming together is a beginning, staying together is progress, and working together is success.” — Henry Ford At this time
Microsoft Power BI, a cloud-based business intelligence platform, is growing in popularity with many of today’s businesses. Power BI’s interactive
With License Statistics version 6.16, we are excited to announce the addition of support for another new license manager, Altium

Let’s face it. Times are hard, with a myriad of factors causing stress on the global economy. If you’re an
Client: SimVis GmbH Problem: Limited licensing solutions Solution: LM-X License Manager Problem SimVis GmbH, founded in 2008 and located in
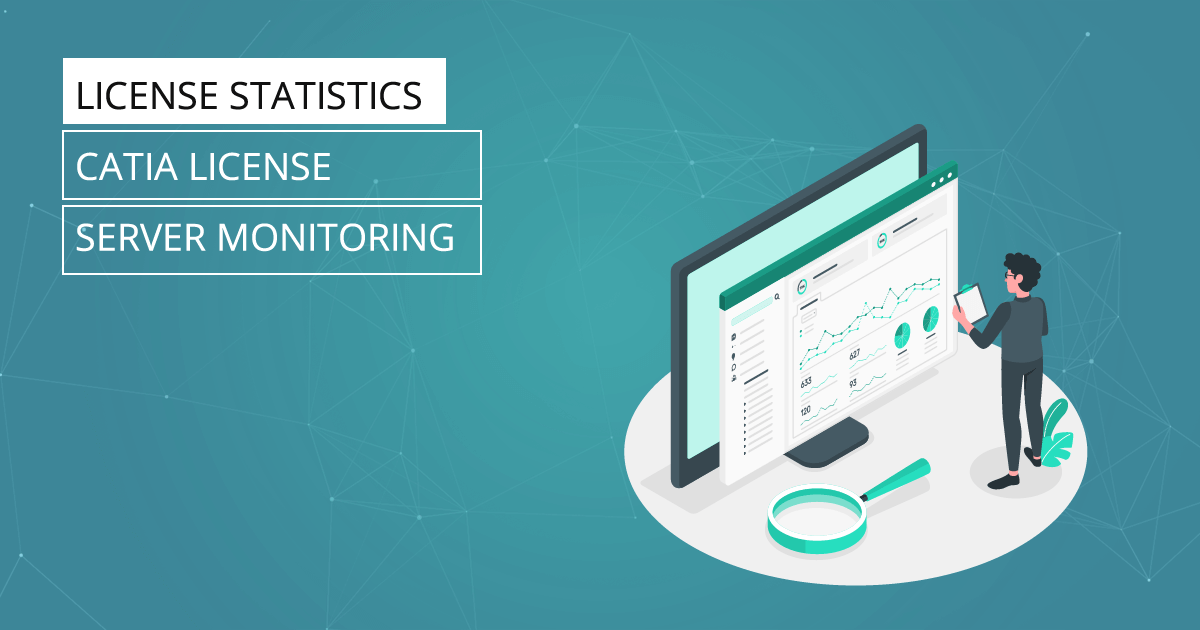
CATIA, produced by Dassault Systèmes and licensed using DSLS (Dassault Systèmes License Server), is a leading provider of solutions for
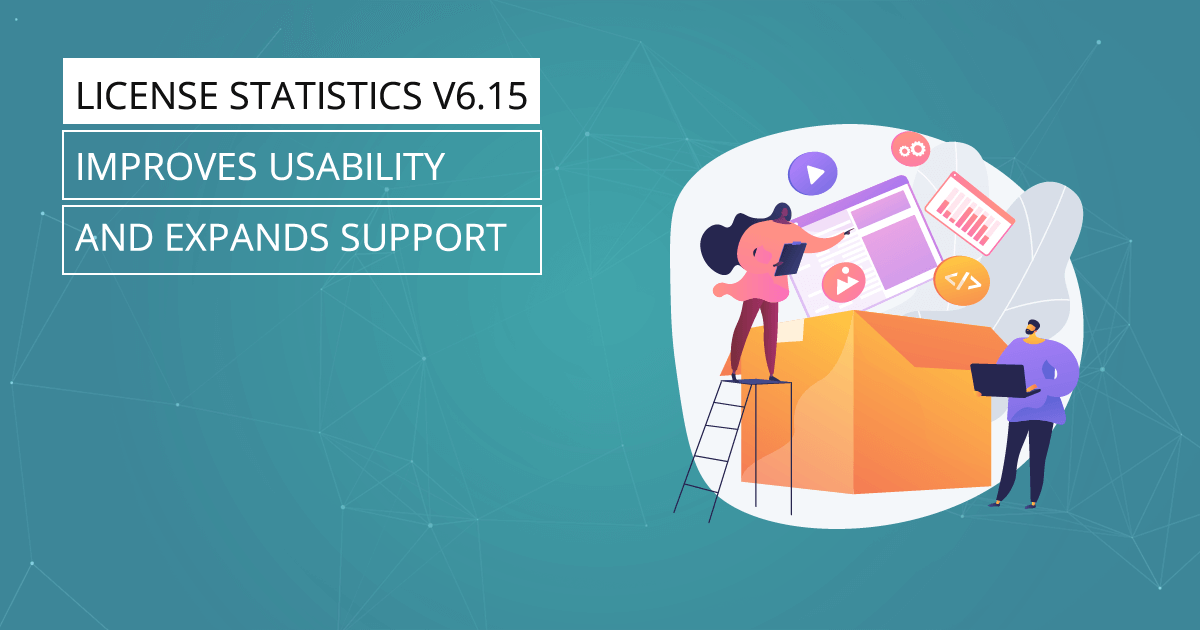
With License Statistics version 6.15, we are excited to announce support for yet another license manager, Green Hills Software (GHS)
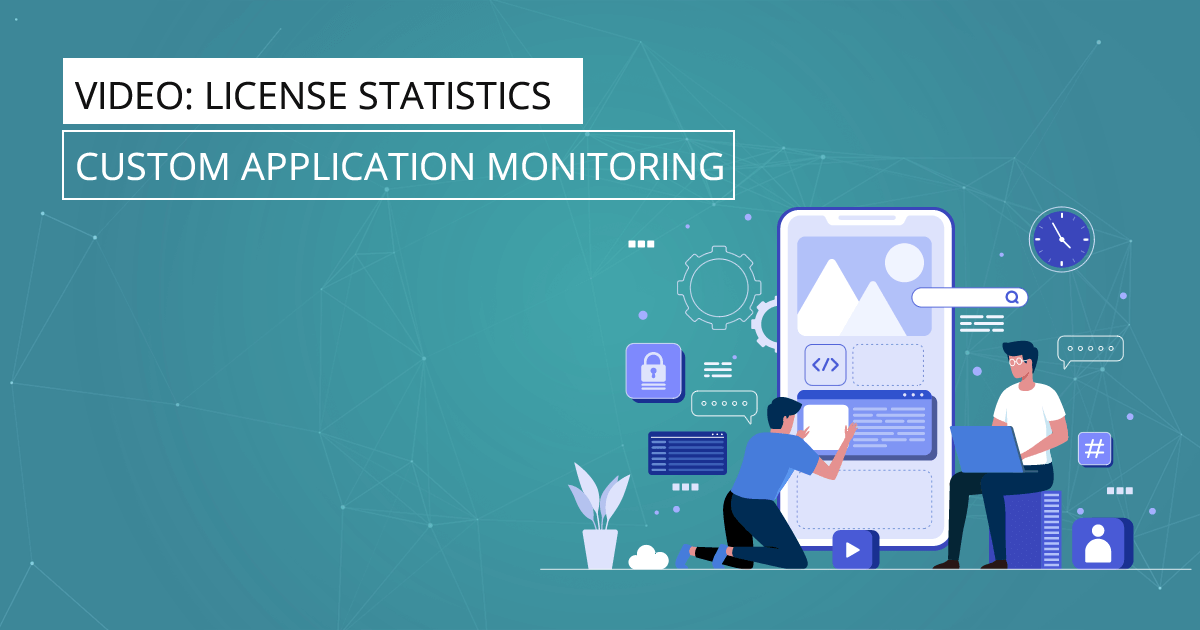
Check out our latest video to learn how License Statistics Custom Application Monitoring delivers a complete solution for monitoring, tracking,
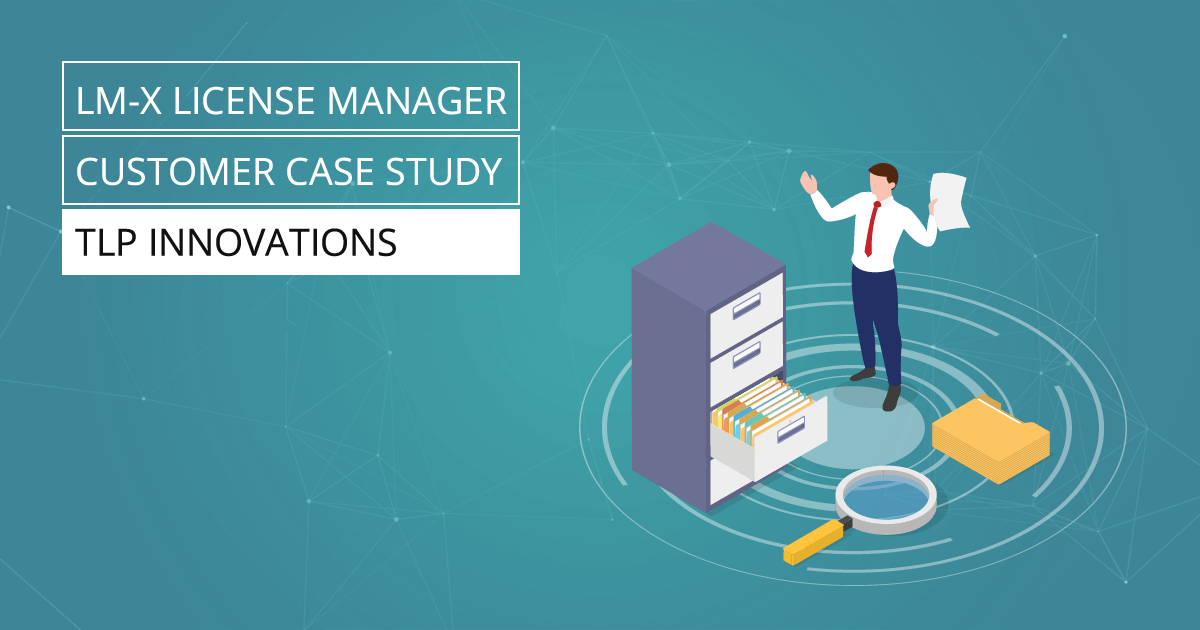
Client: TLP Innovations Problem: How to support geographically dispersed customers Solution: LM-X License Manager Problem TLP Innovations produces Train Load
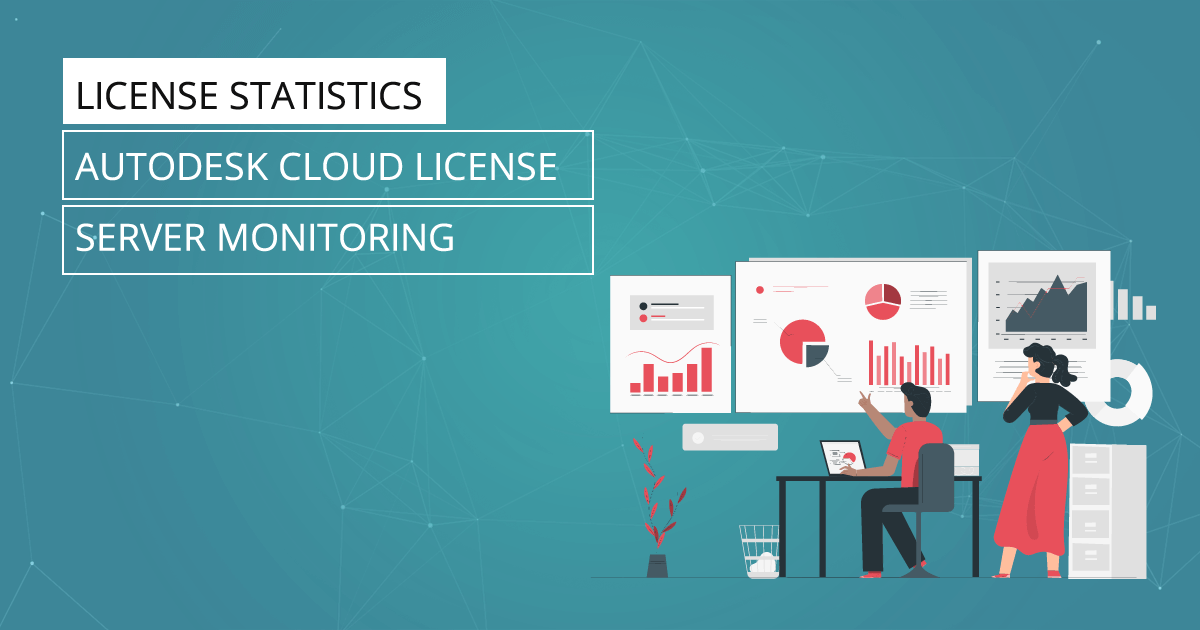
More and more, we’re finding that our customers’ heads are in the clouds–at least when it comes to managing their
“Challenges are what make life interesting and overcoming them is what makes life meaningful.” — Joshua J. Marine It’s been
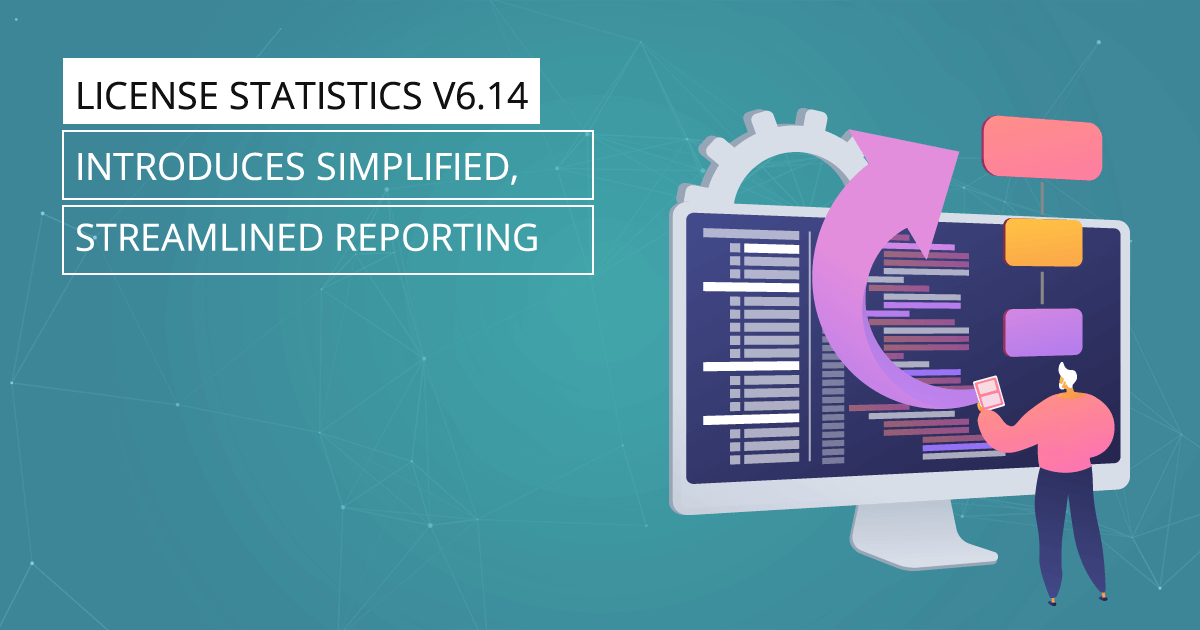
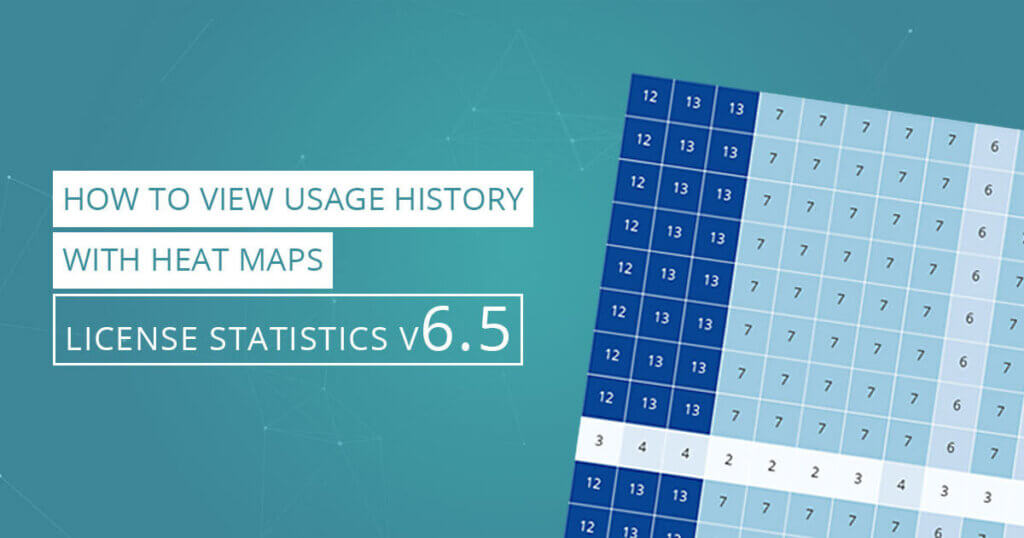
With License Statistics version 6.14, we’re making your life even easier, with simplified, streamlined reports that more clearly divide realtime
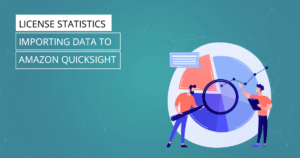
Amazon QuickSight is a cloud-scale business intelligence (BI) service that lets you connect to and combine your cloud data from many different sources – such
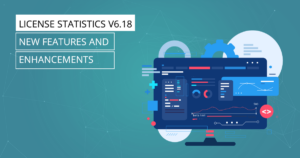
With License Statistics version 6.18, we’ve introduced a combination of over 40 new features and enhancements that are sure to make License Statistics even more
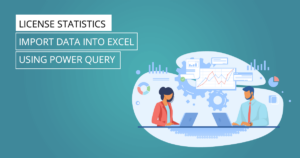
Many of our License Statistics customers are using Excel’s Power Query tool to transform and prepare data. Power Query not only lets you import data
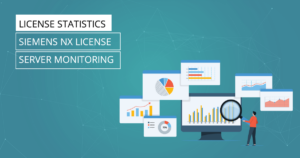
Based in Munich, Germany, and with offices abroad, Siemens Digital Industries Software (previously Siemens PLM) is Europe’s largest industrial manufacturing company. One of their most
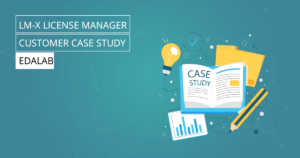
Client: EDALab s.r.l. Problem: Different licenses types for one product Solution: LM-X License Manager Problem EDALab s.r.l., located in Verona, Italy, originated in 2007 as
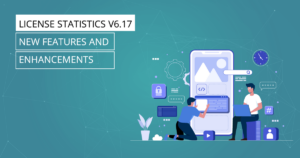
With License Statistics version 6.17, we’re excited to announce new License Server Management capabilities (currently for LM-X and FlexNet license servers only). In prior versions

“Coming together is a beginning, staying together is progress, and working together is success.” — Henry Ford At this time of year, our thoughts often

Microsoft Power BI, a cloud-based business intelligence platform, is growing in popularity with many of today’s businesses. Power BI’s interactive dashboards provide advanced data visualization,

With License Statistics version 6.16, we are excited to announce the addition of support for another new license manager, Altium Infrastructure Server (AIS/PLS) license manager
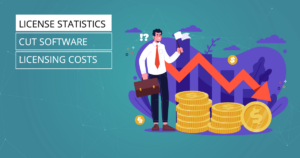
Let’s face it. Times are hard, with a myriad of factors causing stress on the global economy. If you’re an owner or manager of just